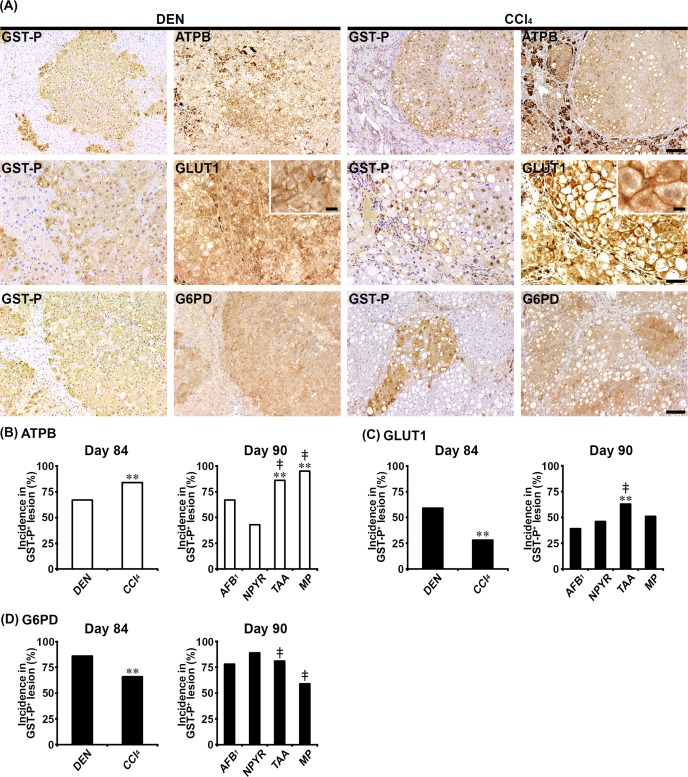
Fig. 1.
Immunohistochemical cellular distribution of adenosine triphosphate (ATP) synthase subunit beta, mitochondrial precursor (ATPB), solute carrier family 2, facilitated glucose transporter member 1 (GLUT1), and glucose-6-phosphate 1-dehydrogenase (G6PD) in association with glutathione S-transferase placental form-positive (GST-P+) liver cell foci after treatment with genotoxic [N-nitrosodiethylamine (DEN), aflatoxin B1 (AFB1), or N-nitrosopyrrolidine (NPYR)] or non-genotoxic hepatocarcinogens [carbon tetrachloride (CCl4), thioacetamide (TAA), or methapyrilene hydrochloride (MP)] for 84 or 90 days. (A) Representative images of the expression of ATPB, GLUT1, and G6PD in GST-P+ foci in the DEN and CCl4 groups (×10 objective; GLUT1 ×20 objective; inset ×60 objective). Bar = 100 µm, 50 µm, or 10 µm (inset). (B) Incidences of ATPB− foci in GST-P+ foci in genotoxic and non-genotoxic hepatocarcinogens. (C) Incidences of GLUT1+ foci in GST-P+ foci in genotoxic and non-genotoxic hepatocarcinogens. (D) Incidences of G6PD+ foci in GST-P+ foci in genotoxic and non-genotoxic hepatocarcinogens. Graphs in (B), (C), and (D) show incidences (% value, n=10) of GST-P+ foci showing altered expression of each molecule (open column, decreased; filled column, increased) in each group. **P<0.01, significantly different from the DEN or AFB1 group by Fisher’s exact test. ‡P<0.01, significantly different from the NPYR group by Fisher’s exact test.

