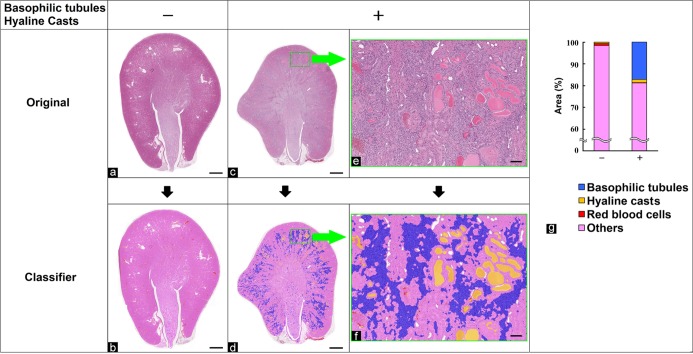
Fig. 3.
Quantification of the areas of basophilic tubules and hyaline casts in the kidney. (a, c, e) Original images. (b, d, f) Segmented images of basophilic tubules (blue), hyaline casts (yellow), red blood cells (red), and other regions (pink) using the tissue classifier module. (e, f) Enlarged images of green frames in (c) and (d), respectively. Grade of basophilic tubules and hyaline casts evaluated by pathologists: (a, b) no change, −; (c–f) slight, +. Bar = 1 mm (a–d) and 100 μm (e, f). (g) Quantitative results for segmented areas (% of the whole area of the kidney section).

