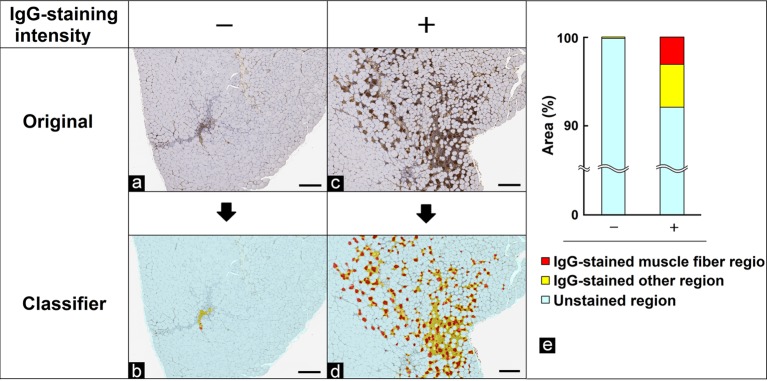
Fig. 5.
Quantification of the IgG-stained muscle fibers area. (a, c) Original images. (b, d) Segmented images of the IgG-stained muscle fiber region (red), IgG-stained other region (yellow), and unstained region (light blue) using the tissue classifier module. Grade of the IgG-stained muscle fiber (degeneration/necrosis of muscle fibers) area evaluated by pathologists: (a, b) no change, −; (c, d) slight, +. Bar = 200 μm. (e) Quantitative results for segmented areas (% of the whole area of the skeletal muscle section).

