Fig. 7.
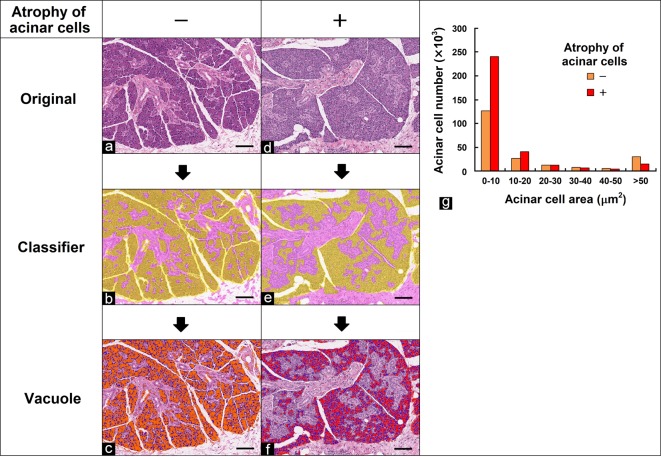
Quantification of the number of acinar cells in the parotid gland. (a, d) Original images. (b, e) Segmented images of acinar cells (yellow) and other regions (pink) using the tissue classifier module. (c, f) Analyzed images of acinar cell size using the vacuole module. Nuclei are blue. Grade of atrophy of acinar cells evaluated by pathologists: (a, c) no change, − (orange); (d, f) slight, + (red). Bar = 100 μm. (g) Quantitative results for acinar cell size. Total area of acinar cells per size. The numbers of acinar cells within 10-μm2 size fractions ranging from 0 to 50 μm2 and the number of those >50 μm2 in size were calculated.

