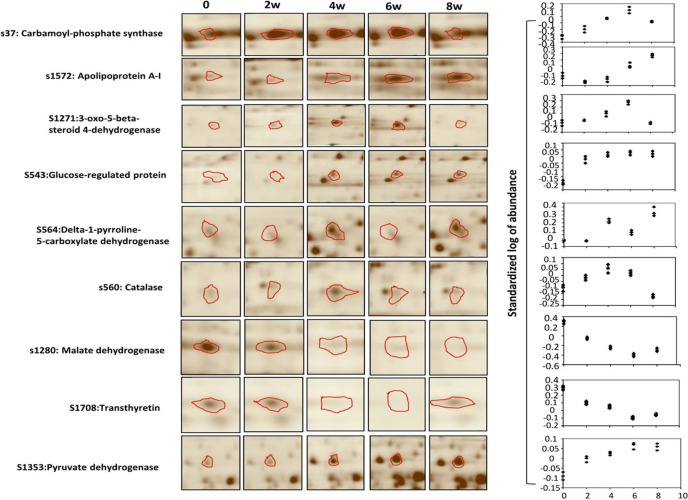
Fig. 3.
The dynamic profiles of some key protein spots. Graphical representations of partial protein spots that showed dynamic changes during the 8 weeks of HFD induction; the left panel shows the images of the spots in the 2D gel. The volume of each spot was calculated and normalized by the Decyder-DIA software (right panel). Values are indicated as the standardized log of abundance.

