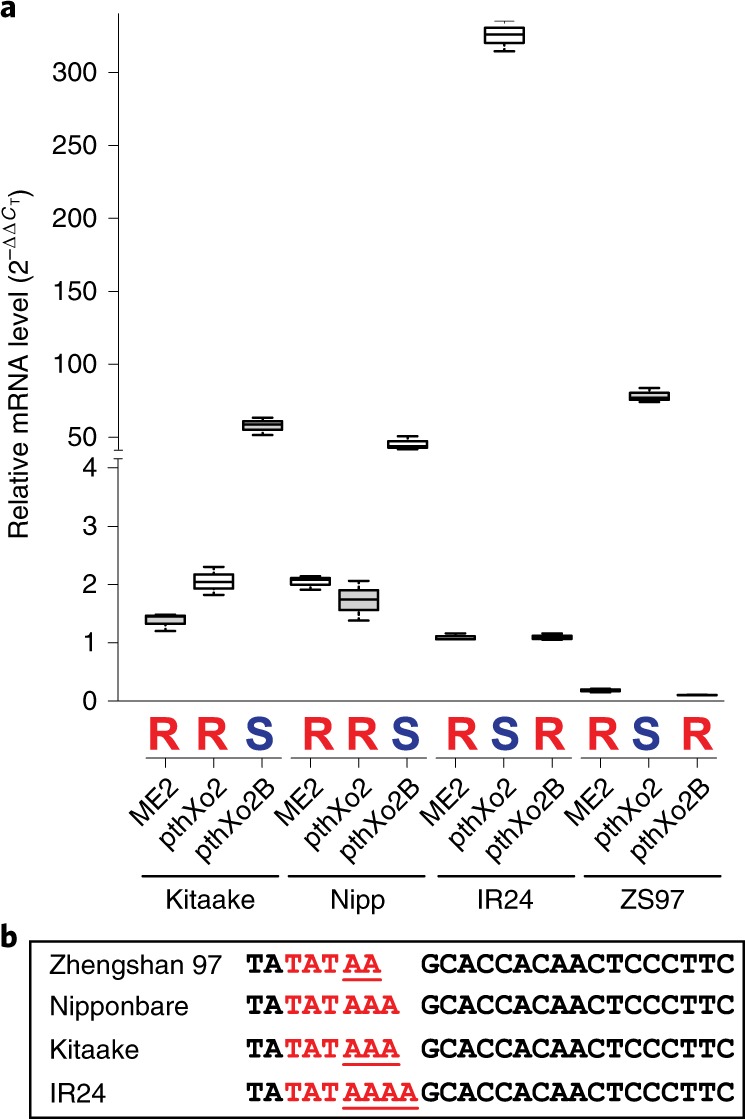
Fig. 3. Functional analysis of PthXo2 homologs in four rice varieties.

The genes pthXo2 and pthXo2B were introduced into ME2 (a non-virulent derivative of PXO99A, lacking pthXo1). a, SWEET13 induction in four rice varieties by Xoo strains (rice actin 1 as control). Data are plotted using BoxPlotR (see Methods); center lines show medians, box limits indicate the 25th and 75th percentiles. The experiment was repeated three times independently with comparable results. Bold letters above strains indicate susceptibility score (red R, resistance; blue S, susceptibility). Actual data for resistance or susceptibility are shown in Supplementary Fig. 5. ZS, Zhengshan. b, Nucleotide variations (underlined) in EBE regions for PthXo2-related TALes in selected rice varieties. The predicted TATA box is highlighted in red.
