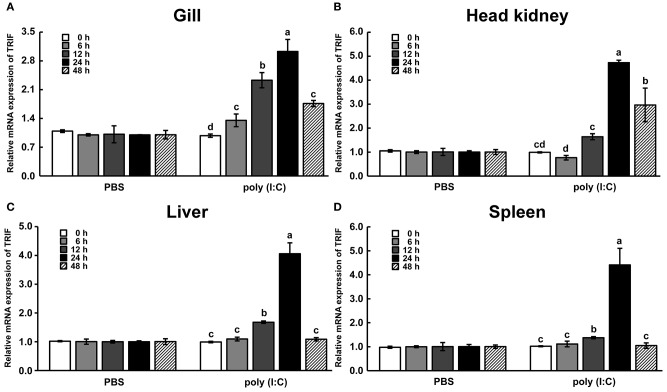
Figure 4.
LcTRIF mRNA expression in immune-related tissues: gill (A), head kidney (B), liver (C), and spleen (D) at different time points post poly (I:C) stimulation in large yellow croaker. Values (mean ± SD of three independent experiments with 4 technical replicates each) in bars that have the same superscript letter are not significantly different (P > 0.05, Tukey's test).

