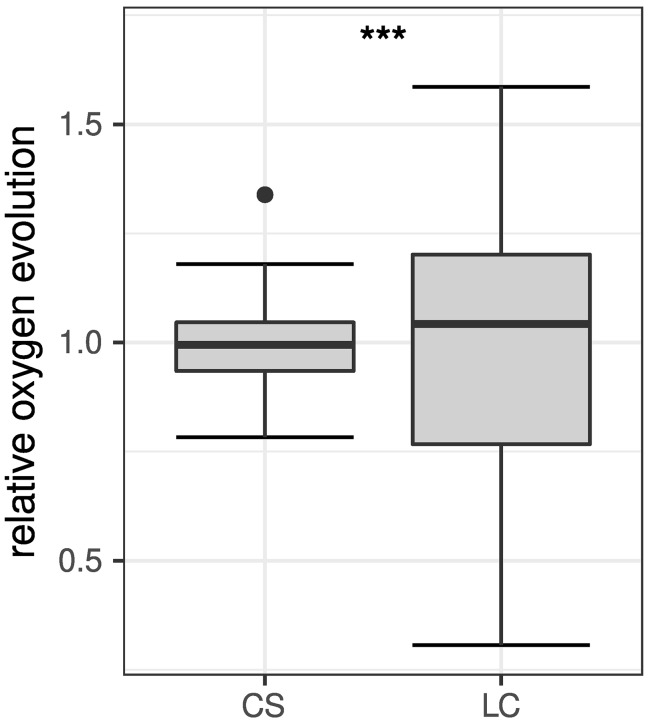
Figure 3.
Comparison of relative POE obtained from cell suspension (CS, n = 30) and leaf cutting (LC, n = 21) assays. Data was normalized to the respective mean of each measurement series for better comparability and are shown as boxplots (Tukey 1977). The box represents the interquartile range (IQR) while the median is depicted by a solid line. Whiskers include data within 1.5 × IQR. Data points beyond this range are shown individually depicted by a filled circle (•). The difference between variances of both datasets is statistically highly significant (***p ≤ 0.001) according to F-test results (F = 0.12332, p = 6.988 · 10−7).

