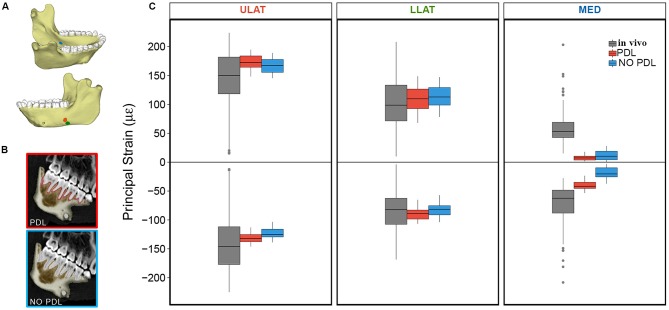
Figure 1.
(A) Mandible model with markers indicating locations of the ULAT (red), LLAT (green), and MED (blue) strain gauge sites (modified from Panagiotopoulou et al., 2017: Figure 7). (B) CT scan slices of mandible indicating the breakdown of the PDL and NO PDL models. (C) Box plots of ε1 (positive) and ε2 (negative) principal strain magnitudes at the ULAT, LLAT, and MED gauge sites for PDL and NO PDL FEMs and the in vivo experiment. Center lines represent the median, upper and lower box boundaries represent 25th and 75th percentiles, respectively; upper and lower whiskers represent 1.5 × inter-quartile range; points are outliers.

