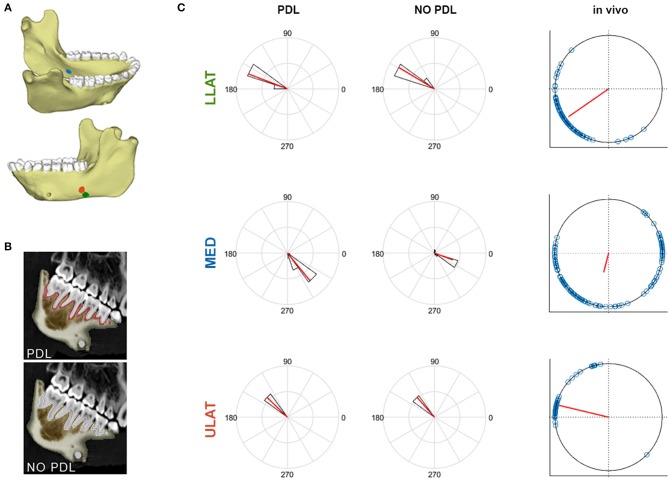
Figure 2.
(A) Mandible model with markers indicating locations of the ULAT (red), LLAT (green), and MED (blue) strain gauge sites. (B) CT scan slices of mandible indicating the breakdown of the PDL and NO PDL models. (C) Polar histogram of the distribution of ε1 orientations (in degrees) at the LLAT, ULAT, and MED gauge sites of PDL and NO PDL FEMs compared to the in vivo experiment. Red solid lines indicate the mean orientation. Black bars and blue circles represent the range of FEMs and in vivo data, respectively.

