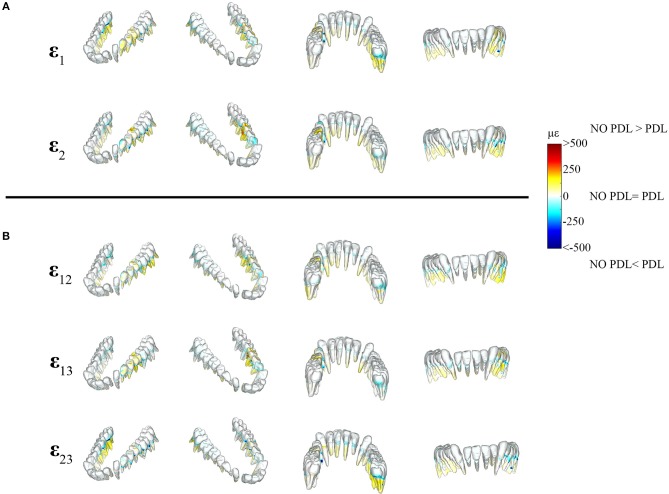
Figure 6.
Color plots of differences in strain magnitudes found in the teeth of FEMs that include (PDL Model) and exclude the periodontal ligament (NO PDL Model). Pairs of FEMs are compared by mapping the cortical bone surface distribution of element level differences in principal strains between the two models onto the surfaces of the teeth. (A) Shows differences in ε1 and ε2 principal strains magnitudes. (B) Shows differences in sagittal (ε12), frontal (ε13), and transverse (ε23) shear strain magnitudes between model pairs in four views. Scale bars to the right of each panel indicate the element level difference in strains (με) between models. Areas of greater difference in results from PDL and NO PDL models are indicated by darker colors, while lighter colors indicate areas of high similarity.

