Fig. 1.
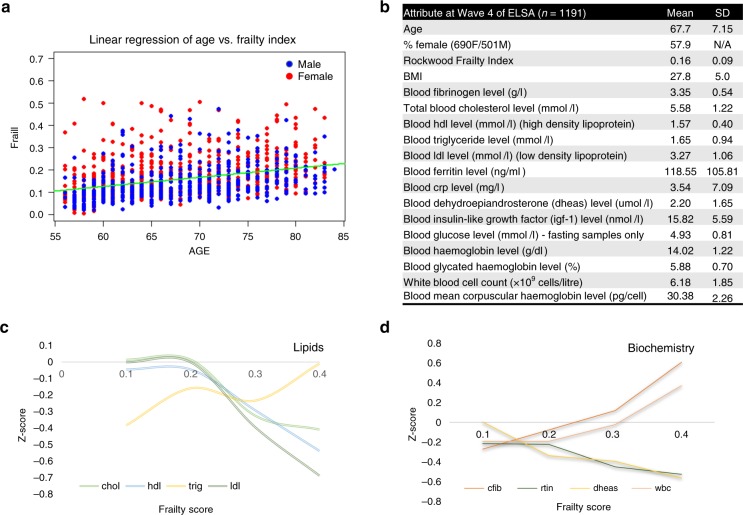
Sample attributes at wave 4 of ELSA. a Linear regression of Age vs. Frailty Index score indicating a moderate correlation and implying that the concept of frailty, when measured under the Rockwood FI scoring system, is an independent variable with respect to age (blue dots = male subjects, red dots = female subjects). b Mean sample characteristics from 1191 subjects and associated blood analysis. c Mean cholesterol levels as observed across the frailty distribution using the standard scoring method. It can be seen that LDL, HDL and cholesterol all decrease when entering the non-frail cut-off50. Triglycerides are seen to increase. d Most pronounced biochemistry levels as observed across the frailty distribution using the standard scoring method. Fibrinogen and white blood cells indicating a marked increased Z-score over the frailty distribution whereas ferritin and dehydroepiandrosterone indicate a decrease. Source data are provided as a Source Data file

