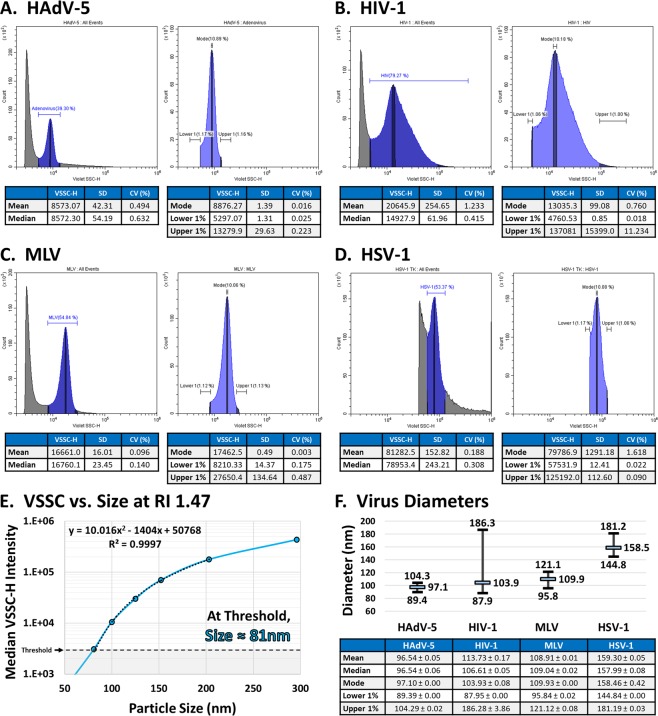
Figure 3.
Sizing Viruses by Flow Cytometry. (A–D) VSSC-H population statistics for (A) HAdV-5, (B) HIV-1, (C) MLV, and (D) HSV-1. Each virus was read in triplicate and the data represent the average. (E) Fitting a VSSC-H Intensity vs. Size curve for RI 1.47 at 405 nm in order to calculate virus sizes. (F) The calculated size characteristics for each virus in (A–D). In the chart above, the calculated peak diameter is displayed along with the size range. The mean and median sizes are also included in the table below, ±the SEM.

