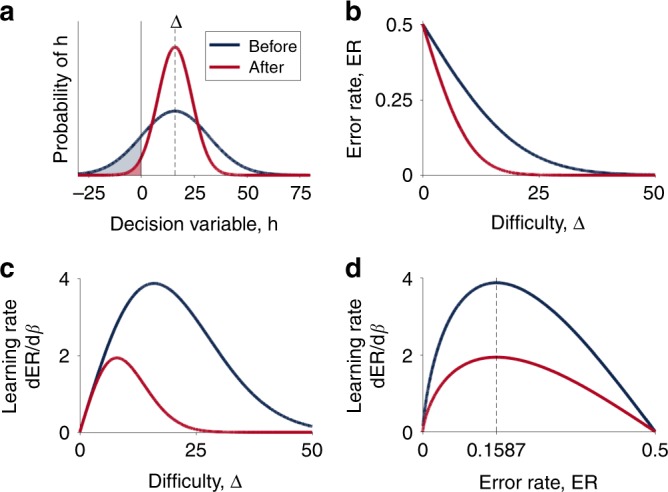
Fig. 1.

Illustration of the model. a Distributions over decision variable h given a particular difficulty, Δ = 16, with lower precision before learning and higher precision after learning. The shaded regions corresponds to the error rate—the probability of making an incorrect response at each difficulty. b The error rate as a function of difficulty before and after learning. c The derivative that determines the rate of learning as a function of difficulty before and after learning showing that the optimal difficulty for learning is lower after learning than before. d The same derivative as in c re-plotted as a function of error rate showing that the optimal error rate (at 15.87% or ~85% accuracy) is the same both before and after learning
