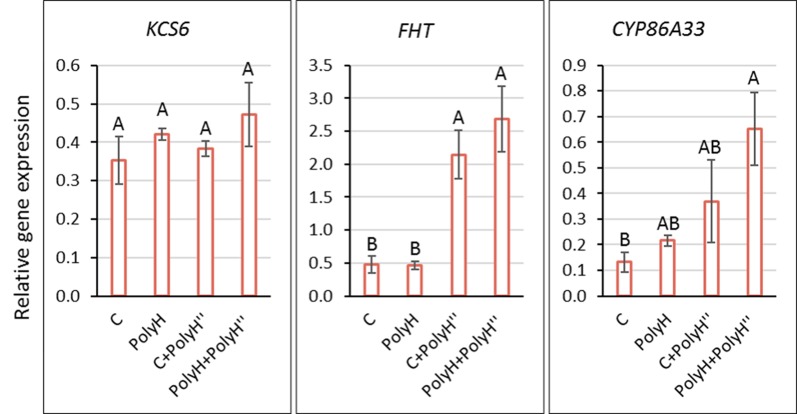
Figure 3.
Expression of KCS6, FHT, and CYP86A33 indicator genes for skin suberization in the peel of Rosanna tubers from experiment 1. Samples labeling is as described in legend of Figure 1 . Peel samples were collected at harvest (135 DATP). Transcript levels were monitored by qPCR and expression levels were normalized relative to that of the reference gene α-NAC. Values are averages of three replicates with SE. Data were analyzed for statistical significance by Student’s t-test; different letters indicate significantly different values (P < 0.05).

