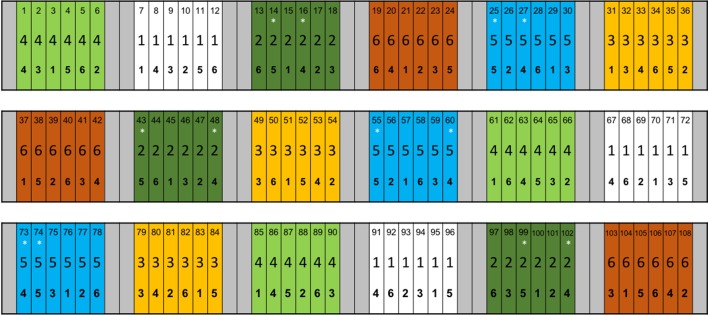
Figure 1.
ADAS experiment established at Sancton, East Riding of Yorkshire, UK. Six barley (Hordeum vulgare L.) cultivars were planted at the trial site, and received one of 6 N addition rates, ranging from 0 to 300 kg ha−1. Each combination of barley cultivar and N rate was replicated 3 times. Each plot has 3 numbers, denoting: plot identity, N addition rate and barley cultivar, reading top to bottom. Nitrogen addition rate “2” represents 60 kg ha−1 and “5” is 280 kg ha−1. Plot colours also represent N addition rate. Meridian barley is denoted by “4” and Maris Otter by “5”. Asterisks (*) represent plots from which root samples were taken for analysis of root length colonisation and to which 15N tracer was added. Reproduced with permission from Pete Berry and Kate Storer, ADAS.

