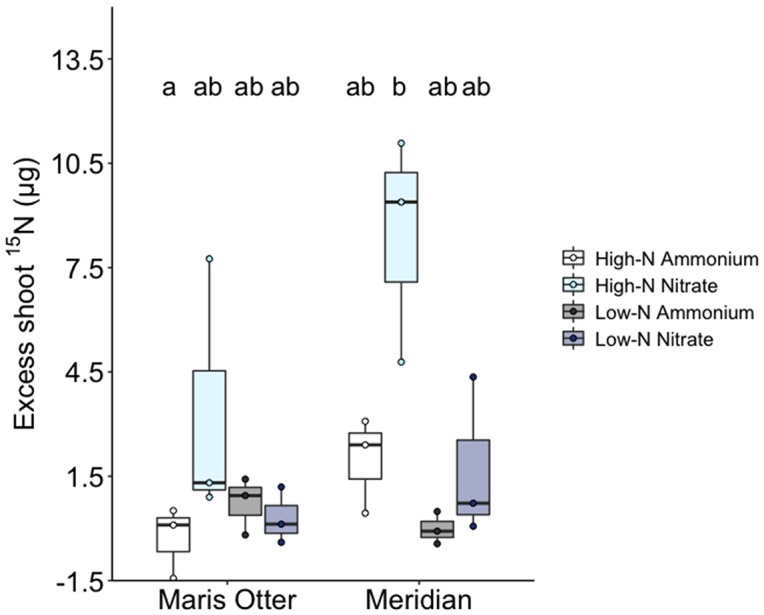
Figure 3.

Excess 15N content in Maris Otter and Meridian shoots (calculated by subtracting shoot 15N content in each “Access” unit from the mean of the corresponding values in the “No Access” units). Shoot 15N enrichment was significantly higher than “no access” controls when supplied as nitrate to Meridian barley in High-N plots. Circles represent individual data points, boxplot centre bars represent the median values. High-N + ammonium groups are represented by white bars, High-N + nitrate by light blue bars, Low-N + ammonium by dark grey bars and Low-N + nitrate by dark blue bars. Data shown are means ± SEM, n = 3. Bars sharing the same letter are not significantly different.
