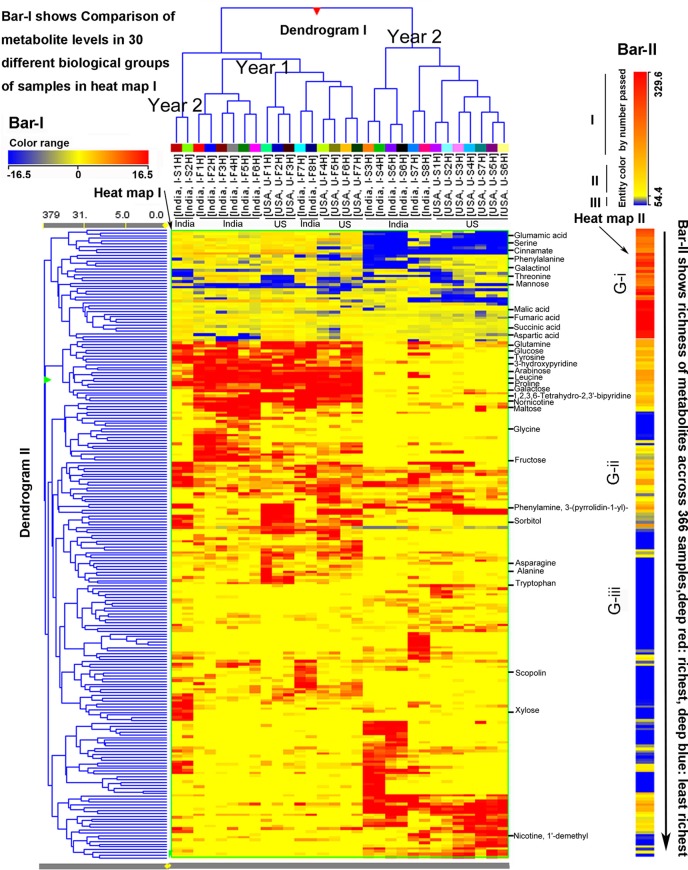
Figure 4.
Hierarchical cluster analysis (HCA) for two consecutive years’ polar metabolomes from leaves of Nicotiana tabacum K36 grown in the field of India and North Carolina. A heat map resulted from HCA using log2-fold changes of 225 metabolites during two growing seasons in India and USA. Fold changes and color (bar-I) resulted from normalization that was carried out using each log2 value of each metabolite peak value in each sample to compare its median peak value across all 366 extracted samples. Two color bars, bar-I and bar-II, are used in the heat map. The horizontal bar-I fold color bar (16.5 to −16.5) from deep red to deep blue shows high to low levels of each metabolite in different groups of biological samples. The bar-II entity color by number passed (329.6–54.4) and the long arrow from the top to the bottom featured using deep red to deep blue color indicate the frequency of metabolites detected from the highest (deep red) to the lowest (deep blue) richness in all 366 extracted samples. For example, glutamic acid listed in the top of the heat map was the most abundant metabolite detected in all samples, while xylose listed in the relative bottom with deep blue color was one of the least abundant metabolite detected in all samples. Samples were labeled by their abbreviations. I-F1H through F8H are India’s samples in the first year from positions 1 to 8 harvest. U-F1H through F7H are USA’s samples in the first year from positions 1 to 7 harvest. I-S1H through S8H are India’s samples in the second year from positions 1 to 8 harvest. U-S1H through S7 are USA’s samples in the second year from positions 1 to 7 harvest. N = 366: 366 extracted samples.

