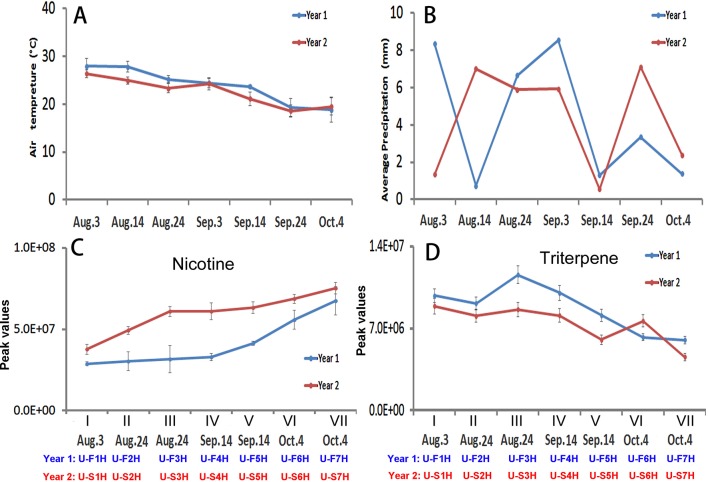
Figure 5.
Dynamics of two climate factors and trends of two groups of metabolites in two harvesting seasons in North Carolina. (A–B), Dynamics of average temperature (A) and precipitation (B) values at seven harvesting dates. Each value resulted from averaging daily temperature or precipitation levels in that week of harvest. (C-D) Trends of total nicotine levels (C) triterpene levels (D) in seven groups of samples harvested on the four harvesting dates. I, II, III, IV, V, VI, and VII: seven groups of samples, in which II and III were collected on Aug. 24, IV and V were collected on Sept. 14, and VI and VII were collected on Oct. 4.

