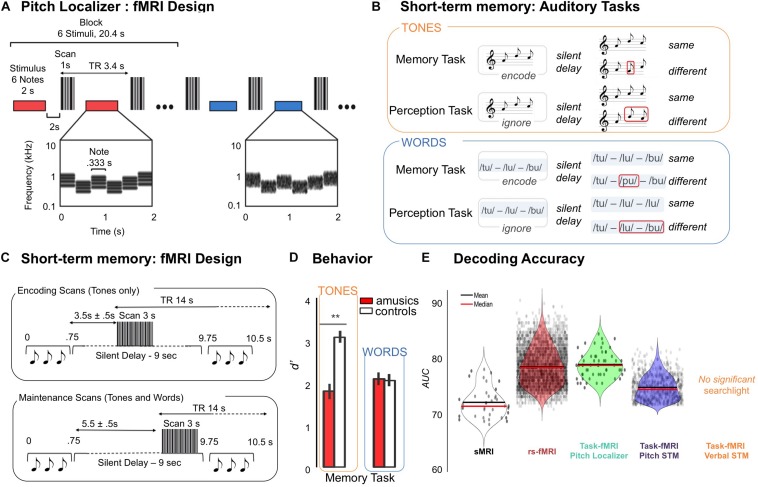
FIGURE 1.
(A) Pitch localizer, schematic of the experimental design. fMRI responses were measured to harmonic tones and Gaussian noise spanning the same frequency range. Stimuli (denoted by horizontal bars) were presented in a block design, with six stimuli from the same condition presented successively in each block (red and blue indicate different conditions). Each stimulus (2 s) included several notes that varied in frequency to minimize adaptation. Cochleograms are shown for an example harmonic tone stimulus (red bar) and an example noise stimulus (blue bar). Cochleograms plot time–frequency decompositions, similar to a spectrogram, that summarize the cochlea’s response to sound. After each stimulus, a single scan was collected (vertical, gray bars). Adapted from Norman-Haignere et al. (2016). (B) Auditory tasks. Examples of the stimuli used in Memory and Perception Tasks. Memory Task: Participants had to compare sequences (tones or words) presented in pairs. For “same” trials the first sequence was repeated as the second sequence of the pair after a 9000 ms delay. For “different” trials, the second sequence of the pair changed only for one item (in positions 1 to 3, red square). For tonal material, the new item changed the melodic contour. Perception Task: Participants had to compare the two last items (tones or words) of the second sequence regardless of the first sequence. For “same” trials, the two last items of the second sequence were identical. For “different” trials, the two last items of the second sequence were different. Adapted from Albouy et al. (2019). (C) Design for the fMRI experiment and timeline of events during one trial. S1 sequence (pitch sequences, words) lasted 750 ms and was followed by a constant 9000 ms silent delay during which occurred 3000 ms of functional data acquisition which was followed by the second sequence (750 ms). Participants had 2000 ms to respond, the next trial occurring 2500 to 3000 ms after the end of S2. A 0 to 500 ms jitter was added at the beginning of the trial to maximize the detection of the BOLD response for the task. As a function of the run, the acquisition of the whole brain volume was realized at two different time periods. Left panel: For Encoding runs (two runs, pitch Material only), acquisition started 3500 to 4000 ms after the end of the S1 sequence. For Maintenance runs (two runs for pitch tasks and two runs for verbal tasks), the volume acquisition occurred just before the second sequence (at the end of the silent delay), the acquisition thus starting from 5500 to 6000 ms after the end of S1. Adapted from Albouy et al. (2019). (D) Right Panel: Performance of amusic and control groups (white, Controls; red, Amusics) in terms of dprime, presented as a function of Material (pitch, words), and Group (amusics, controls) for the short-term memory tasks. Error bars indicate SEM. Adapted from Albouy et al. (2019). (E) Group classification results for structural (sMRI), resting state functional connectivity (rs-fMRI), and task related fMRI [pitch localizer (PL); pitch memory (PM); verbal memory (VM)]. Results are expressed as area under the receiver-operator-characteristic curve (AUC). AUC uses the distance of a classification output to the decision boundary. Violin plots represent the mean and the median of the AUC in brain regions that were significantly classifying amusics and controls as revealed by searchlight analysis (black dots indicate significant searchlights for each analysis).

