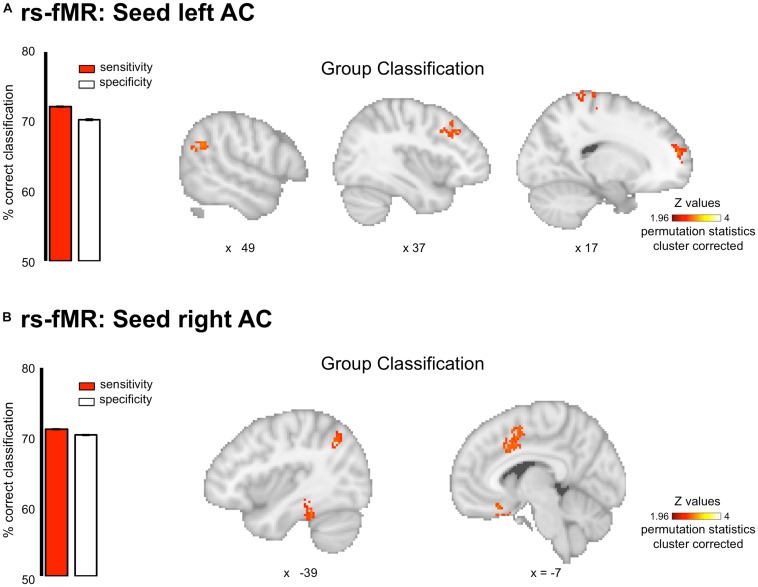
FIGURE 3.
Group classification for the resting state connectivity data. Classification was performed on whole brain connectivity maps with seeds in the left (A) and right (B) auditory cortices. Results are displayed single participant T1 in the MNI space provided by SPM12. Bar plots represent sensitivity (red) and specificity (white) of the classifier.

