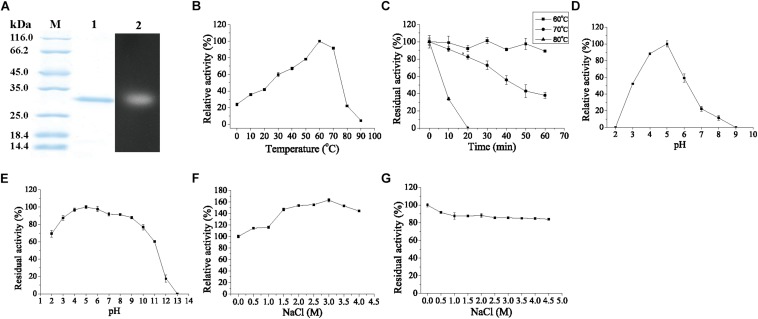
FIGURE 3.
SDS-PAGE and zymogram analysis of purified Chi23 and Biochemical characterization of Chi23 using colloidal chitin as substrate. (A) SDS-PAGE and zymogram analysis of purified Chi23. Lane M, protein mass markers; lane 1, purified Chi23; lane 2, zymogram of Chi23. (B) Effect of temperature on the activity of Chi23. (C) Effect of temperature on the stability of Chi23. (D) Effect of pH on the activity of Chi23. (E) Effect of pH on the stability of Chi23. (F) Effect of NaCl on the activity of Chi23. (G) Effect of NaCl on the stability of Chi23. The graphs show data from triplicate experiments (means ± SD).

