Fig. 8.
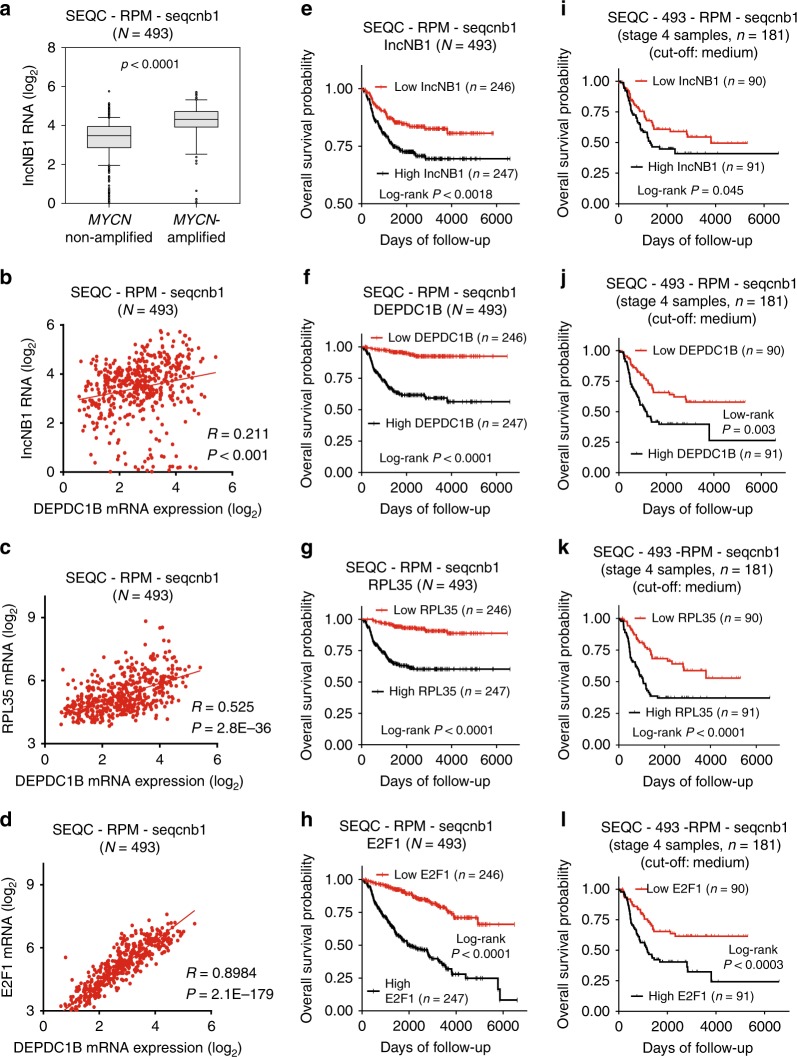
High lncNB1, DEPDC1B, E2F1, and RPL35 in tumor tissues predict poor patient prognosis. a, b Two-sided unpaired Student’s t-test and two-sided Pearson’s correlation were employed to analyze the association between lncNB1 RNA expression and MYCN gene amplification (a) or DEPDC1B mRNA expression (b), respectively in 493 human neuroblastoma tissues in the publicly available RNA sequencing gene expression-patient prognosis SEQC-RPM-seqcnb1 dataset, downloaded from the R2 platform [http://r2.amc.nl]. In the box and whisker plot (a), the center line was the median, the ends of the box were the upper and lower quartiles, and the whiskers extended to the highest and the lowest 10% values. c, d Two-sided Pearson’s correlation was employed to analyze the correlation between RPL35 and DEPDC1B mRNA expression (c), as well as between E2F1 and DEPDC1B mRNA expression (d), in the SEQC-RPM-seqcnb1 dataset. e–h Kaplan–Meier curves showed the probability of overall survival of neuroblastoma patients according to the levels of lncNB1 (e), DEPDC1B (f), RPL35 (g), and E2F1 (h) expression in tumor tissues in the SEQC-RPM-seqcnb1 dataset, using the median of RNA expression as the cut-off points and two-sided log-rank test. i–l Kaplan–Meier curves showed the probability of overall survival of 181 stage 4 neuroblastoma patients according to the levels of lncNB1 (i), DEPDC1B (j), RPL35 (k), and E2F1 (l) in the SEQC-RPM-seqcnb1 dataset, using the median RNA expression as the cut-off points and two-sided log-rank test. Source data are provided as a Source Data file

