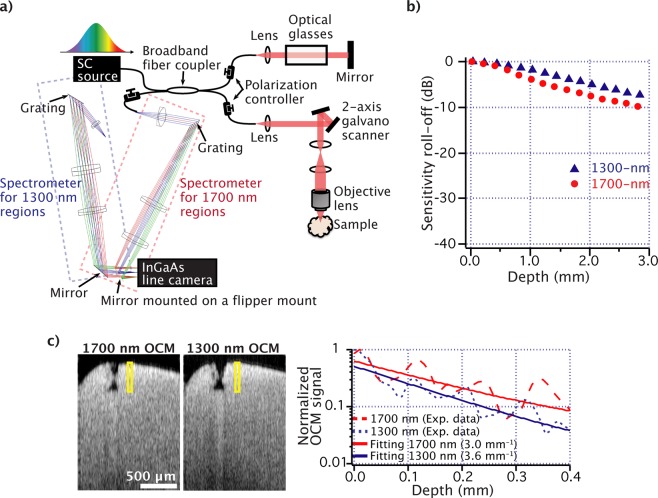
Figure 1.
(a) Experimental setup for SD-OCM in the 1300 nm and 1700 nm spectral bands, (b) their sensitivity roll-off characteristics, and (c) cross-sectional images of a fixed mouse brain obtained with 1700 nm and 1300 nm OCM. The graph in (c) shows OCM signal intensities at different depths. These data were obtained from the yellow solid boxes in the brain images (averaged values along the horizontal direction in the yellow boxes). The dotted lines are measured data, and the solid lines are fitted curves.

