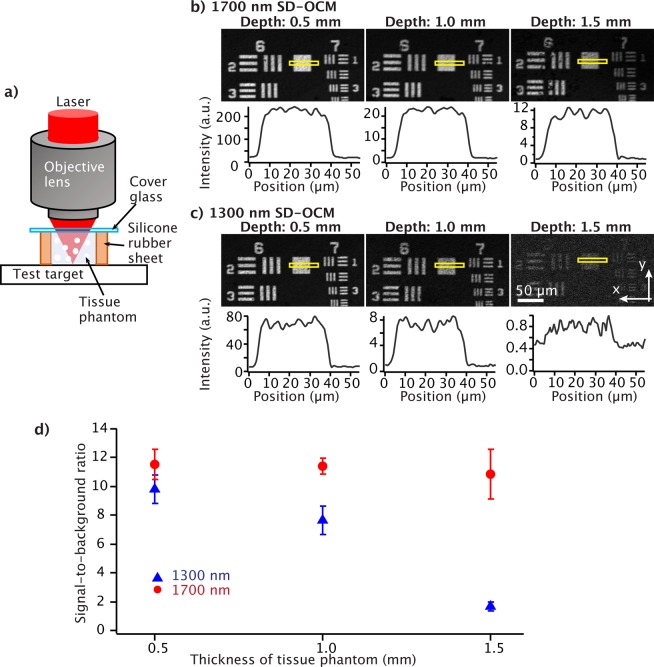
Figure 2.
(a) Experimental configuration for the sample observation. OCM en-face images of the reflective resolution test target through 0.5, 1.0, and 1.5 mm thick tissue phantom obtained by (b) 1700 nm and (c) 1300 nm SD-COM. The images in (b,c) are shown in a linear scale. The graphs in (b) and (c) show the averaged intensity profiles of areas indicated by the yellow boxes in the OCM en-face images. (d) The relationship between SBR and thickness of the tissue phantom.

