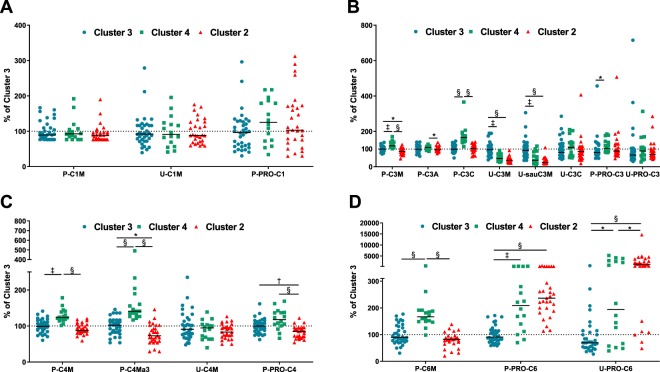
Figure 2.
Collagen turnover biomarkers in Clusters 2–4.Collagen fragments reflecting degradation and formation processes of (A) COL I, (B) COL III, (C) COL IV, and (D) COL VI were shown for patients in Cluster 2–4. Data are presented as percentage of the average biomarker levels in Cluster 3 and depicted as scatter plot with median. Differences between groups was assessed by a Kruskal-Wallis test with Dunn’s multiple comparisons test. Significance level: *p < 0.05, †p < 0.01, ‡p < 0.001, §p < 0.0001.

