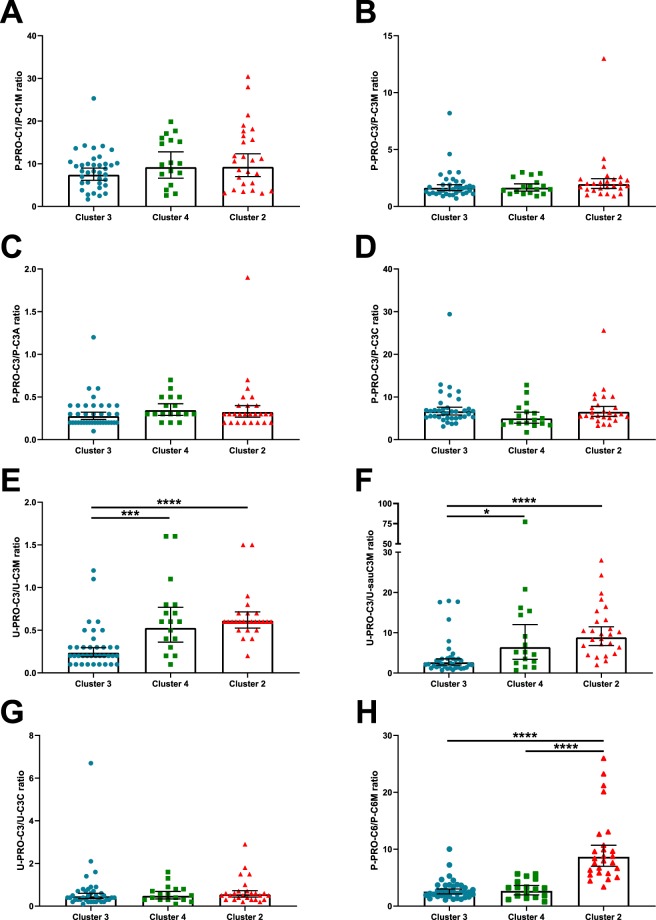
Figure 3.
Ratios between collagen formation and degradation. Formation/degradation ratio of COL I ((A) P-PRO-C1/P-C1M), COL III ((B) P-PRO-C3/P-C3M, (C) P-PRO-C3/P-C3A, (D) P-PRO-C3/P-C3C, (E) U-PRO-C3/U-C3M, (F) U-PRO-C3/U-sauC3M, (G) U-PRO-C3/U-C3C), and COL VI ((H) P-PRO-C6/P-C6M). Results are shown as geometric mean with 95% confidence intervals. Differences between groups was assessed by a Kruskal-Wallis test with Dunn’s multiple comparisons test. Significance level: *p < 0.05, **p < 0.01, ***p < 0.001, ****p < 0.0001.

