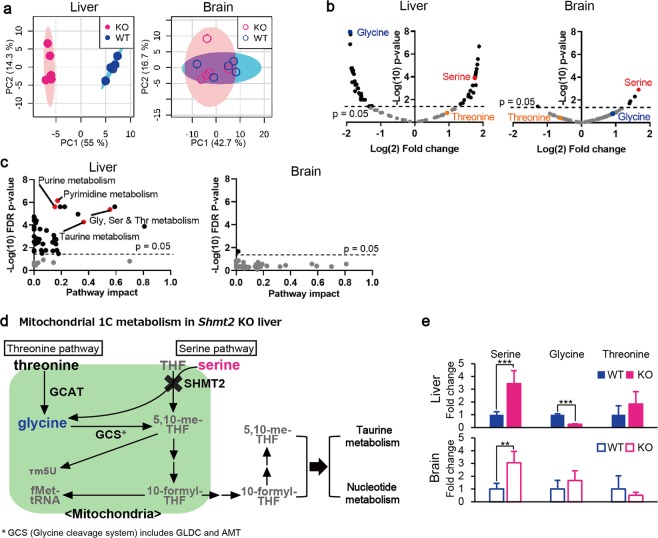
Figure 4.
Metabolomic profiles of livers and brains from wild-type and Shmt2-knockout E13.5 embryos. (a) PCA of livers and brains to compare metabolomic data between wild-type and Shmt2-knockout E13.5 embryos. WT, wild-type foetal livers (closed blue circles), wild-type foetal brains (open blue circles); KO, Shmt2-knockout foetal livers (closed red circles), Shmt2-knockout foetal brains (open red circles). (b) Volcano plots of metabolomic changes caused by Shmt2 knockout in livers and brains from E13.5 embryos. Broken lines, threshold of significance; red dots, serine; blue dots, glycine; orange dots, threonine; black dots, metabolites exhibiting significant changes; grey dots, metabolites without significant changes. (c) Pathway analysis of metabolomic changes caused by Shmt2 knockout in livers and brains from E13.5 embryos. Broken lines, threshold of significance; black dots, pathways with significant changes; red dots, pathways involved in 1C metabolism with significant changes, including taurine metabolism, purine metabolism, pyrimidine metabolism, and glycine, serine, and threonine metabolism; and grey dots, pathways without significant changes. Pathway impact represents a combination of the centrality and pathway enrichment results. (d) A scheme of mitochondrial 1C metabolism in the livers of Shmt2-knockout E13.5 embryos. A red character denotes a metabolite that increased; a blue character denotes a metabolite that decreased; a black character denotes a metabolite that was unchanged in foetal liver without functional Shmt2; grey characters denote metabolites not quantified in this study. THF, tetrahydrofolate; 5,10-me-THF, 5,10-methylenetetrahydrofolate; τ m5U, 5-taurinomethyluridine; fMet, formylmethionine. (e) Effects of Shmt2 knockout on concentrations of serine, glycine, and threonine in livers or brains from E13.5 embryos. WT, wildtype foetal livers (filled blue bars) and wild-type foetal brains (open blue bars); KO, Shmt2-knockout foetal livers (filled red bars) and Shmt2-knockout foetal brains (open red bars). Data represent the mean ± S.D. *P < 0.05; **P < 0.01, ***P < 0.001 (WT, n = 5; KO, n = 5).

