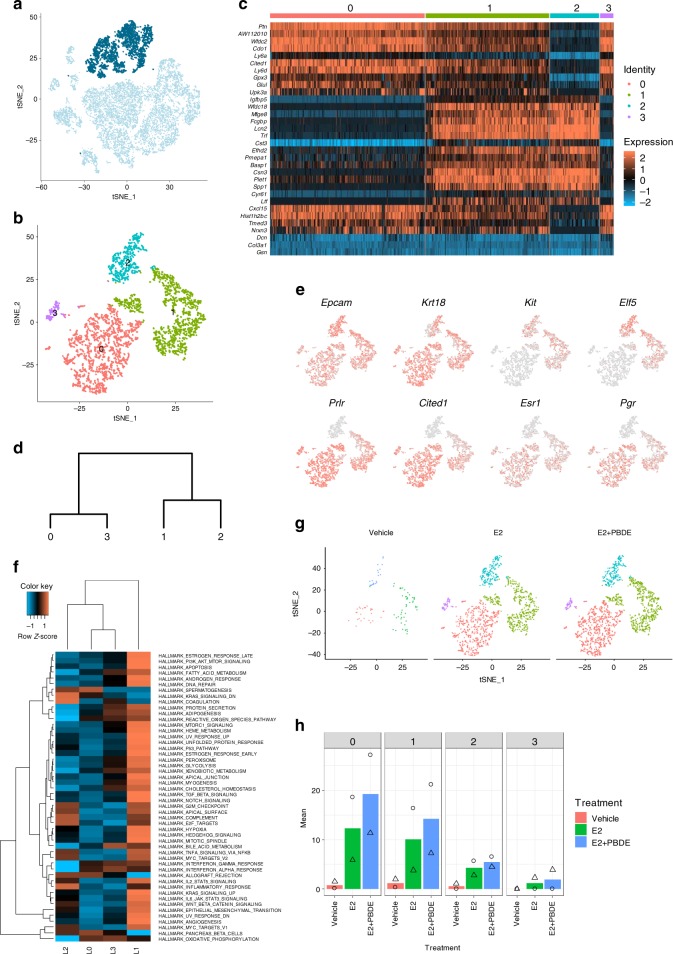
Fig. 3.
Luminal cells were re-clustered to reveal three subpopulations. a Feature plot highlighting clusters C4 and C5, which were putatively identified as luminal epithelial cells based on established epithelial markers, such as Krt18 and Epcam. b T-SNE plot of re-clustered luminal cells shows four distinct clusters. c Heatmap showing specific genes (top 5 differentially expressed genes in each luminal cluster). d Dendrogram showing luminal cluster relationship to other luminal clusters based on gene expression data. e Selected feature plots of genes used to classify the subpopulations of luminal cells into luminal progenitor cells, intermediate luminal cells, and mature luminal cells. f Heatmap on the MSigDB analysis based on the average normalized expression values of genes in the four luminal cell clusters. L1 had the most upregulated pathways relative to the other luminal clusters. g T-SNE plots of luminal cell clustering separated by treatment group. h Cell distributions from two independent experiments by percentage for all three treatment groups among all four luminal cell clusters. Symbols indicate individual cell distributions for each of the two experimental replicates (triangle, circle)

