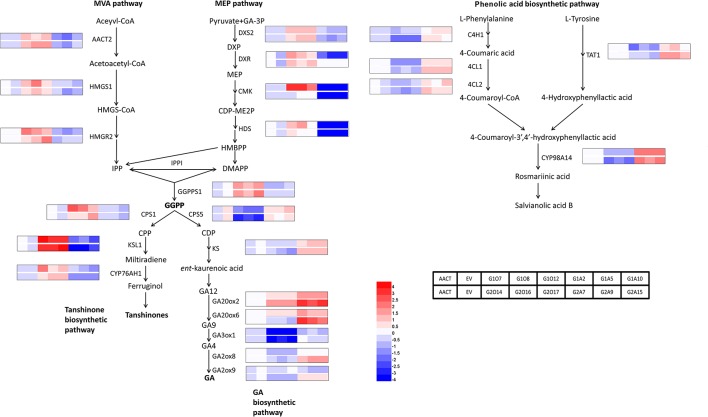
Figure 4.
Relative expression levels of tanshinones, phenolic acids and GA biosynthesis pathway genes in SmGRAS1/2 transgenic and control hairy roots (21-day-old). Each line had three biological replicates. The expression levels were normalized to values in the ATCC lines. Blocks with colors indicate low/downregulated expression (blue), high/upregulated expression (red), or no expression/no change (white).

