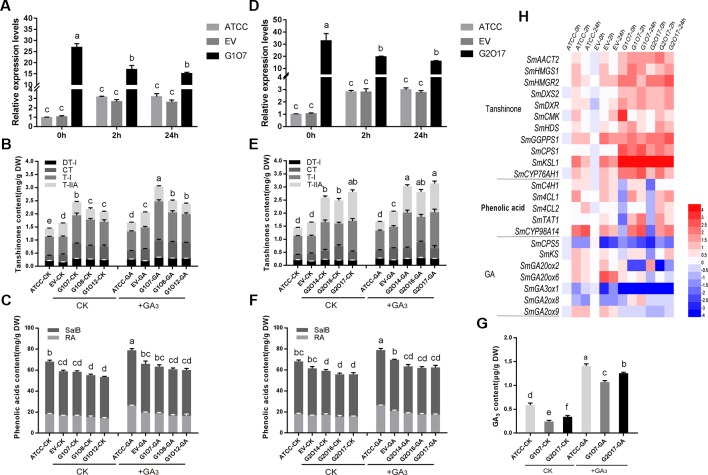
Figure 5.
GA affects the root biomass and the contents of tanshinones, phenolic acids, and GA in SmGRAS1 and SmGRAS2 OE hairy roots. (A, D) Relative quantitative analysis the expressions of SmGRAS1 and SmGRAS2 in the OE lines and controls with or without 100 µM GA treatment for 2/24 h. (B, C) Analysis of tanshinones and phenolic acids productions from SmGRAS1 OE lines and controls with or without 100 µM GA treatment for 6 days. (E, F) Analysis of tanshinones and phenolic acids productions from SmGRAS2 OE lines and controls with or without 100 µM GA treatment for 6 days. (G) Analysis of GA production from SmGRAS1/2 OE lines and controls with or without 100 µM GA treatment for 6 days. (H) Relative expression levels of genes involved in tanshinones, phenolic acids and GA biosyntheses in the SmGRAS1/2 OE lines with 100 µM GA treatment for 2/24 h. Standard errors were calculated from three sets of biological replicates. Significant differences using one-way ANOVA and S-N-K comparison tests, P < 0.05.

