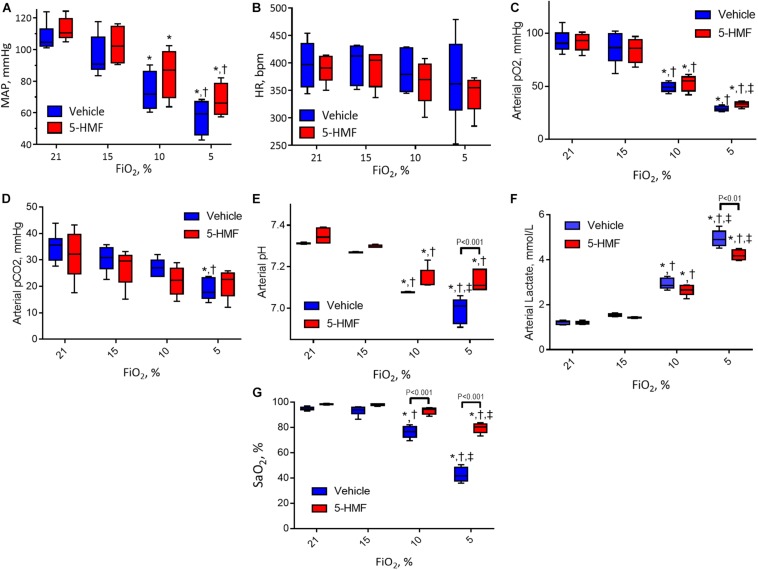
FIGURE 2.
(A) Mean arterial blood pressure (MAP), (B) heart rate (HR), (C) arterial oxygen tension (pO2), (D) arterial partial pressure of carbon dioxide (pCO2), (E) arterial pH, and (F) arterial lactate during the long-term hypoxia protocol. (G) Shows the HbO2 saturation calculated from the pO2 and the Hill equation for HbO2 dissociation with and without 5-HMF. The p50 value used for the 5-HMF treated and vehicle groups are shown in Table 1. Symbols represent statistically significant differences (P < 0.05): ∗ relative to 21% FiO2, † relative to 15% FiO2, and ‡ relative to 10% FiO2.

