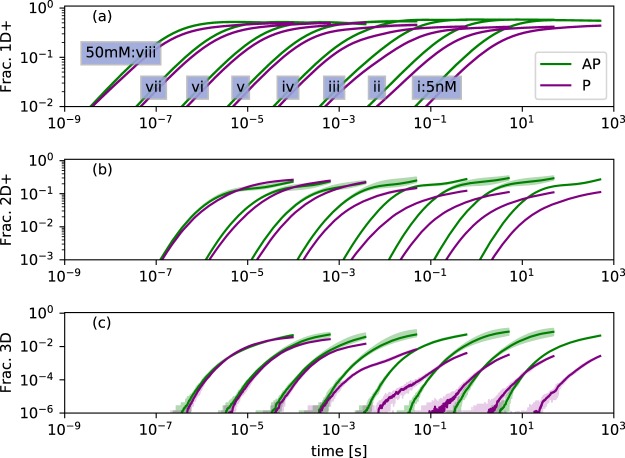
Figure 3.
Evolution of microcrystal formation colored by parallel or antiparallel. Curves i–viii show concentrations increasing from 5 nM in multiples of 10. Spreads show minimum and maximum values reached in 10 replicates. Traces are averages over the replicates. ‘Frac. 1D+’ (a) shows peptides incorporated into any aggregate which is identifiably P or AP, therefore initially describes mostly single-sheet aggregates, for which AP is the most stable geometry. (b) shows formation of 2D aggregates, where complex kinetics driven by the availability of 1D aggregates and the stability of 2D+ aggregates begin to take effect. (c) shows the quite sharp kinetically-driven phase transition between AP dominance and AP-P coexistence in the final sample.

