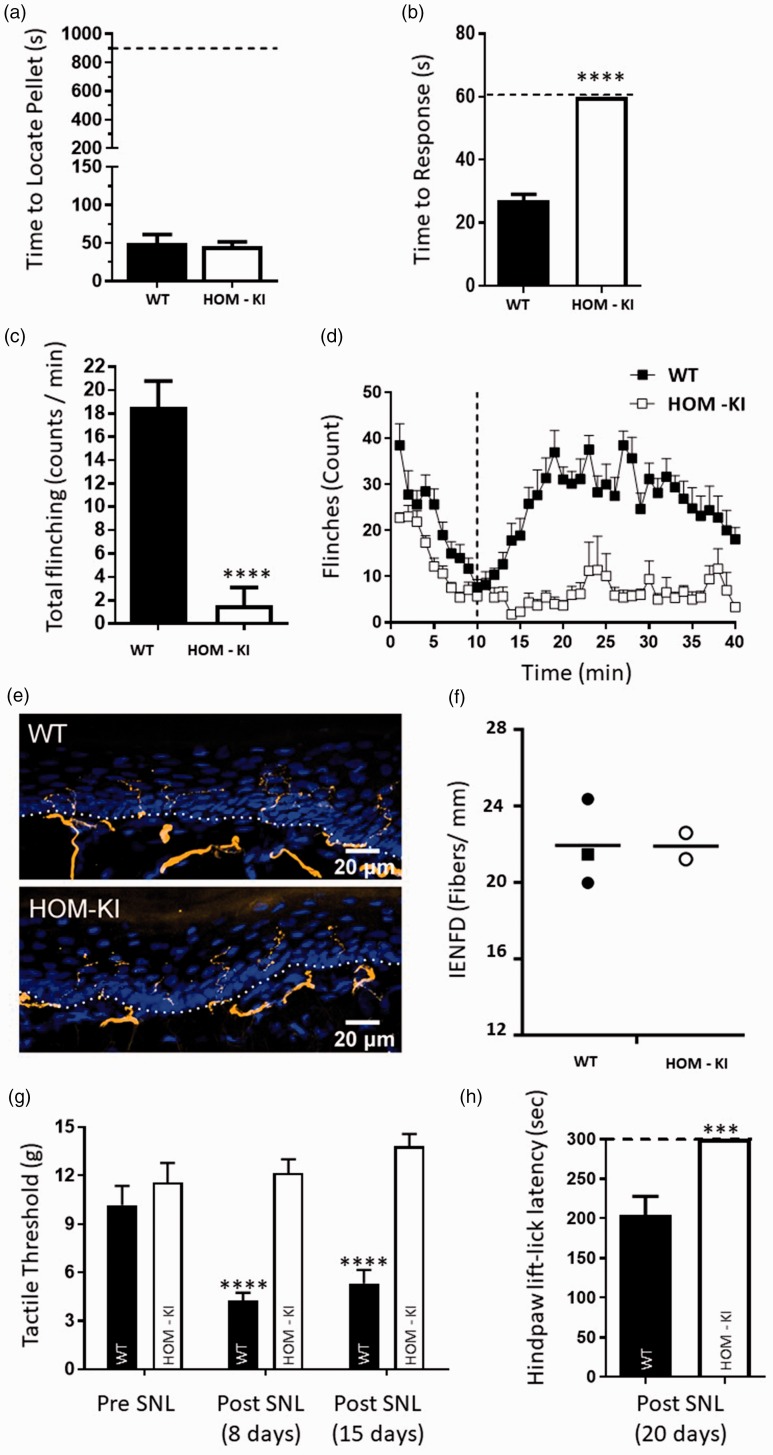
Figure 8.
Behavioral profiling of WT and HOM-KI rats. (a) Olfactory test. WT (49.8 ± 11.4 s) and HOM-KI (45.8 ± 5.8 s) rats were equally able to detect a buried food pellet (t16 = 0.329, p = 0.75, unpaired t-test; n = 8 WT and n = 10 HOM-KI). (b) Hot plate test. HOM-KI rats (60 s) did not respond to a 50°C heat stimulus, reached the 60 s cut-off time and were significantly different than WT rats (27.1 ± 2 s) (****Mann–Whitney U = 0, p = 0.00001; n = 9 WT and n = 10 HOM-KI). (c) Capsaicin chemical challenge. HOM-KI rats (1.5 ± 1.5 flinches) displayed significantly reduced capsaicin-induced flinching compared to WT rats (18.5 ± 2.2 flinches) (****Mann–Whitney U = 8, p = 0.0001, n = 11/group). (d) Formalin test. HOM-KI rats had significantly less flinching behavior than WT rats in phase 1 (0–10 min, HOM-KI: 133.7 ± 7, WT: 213.6 ± 18, **unpaired t test, t = 0.001) and phase 2a (11–40 min, HOM-KI: 187.6 ± 46, WT: 785.4 ± 46, **** unpaired t test, t = 0.00000006) of the formalin test (n= 10 for WT, n = 9 for HOM-KI). (e) Representative images of IENF in hind paw skin biopsies from WT and HOM-KI rats (9–10 weeks old). IENFs labeled with the pan-axonal marker PGP9.5 (orange) extended from the subdermal plexus into the epidermis (nuclei labelled with DAPI in blue). The dashed line indicates the dermis to epidermis division. HOM-KI rats exhibit normal nerve innervation. Confocal microscopy at 40× (Scale bar = 20 µm) (f) Quantification of intra-epidermal nerve fiber density of hind paw skin biopsies. IENF density in HOM-KI samples (21.90 ± 0.69 fibers/mm) was not statistically different from WT samples (21.94 ± 1.29 fibers/mm) using Mann–Whitney U test. Rectangles represent male samples while circles represent female samples. For (e and f), 3 WT and 2 HOM-KI (one male and two females in WT group; two females in HOM-KI group) rats were evaluated. (g) Spinal nerve ligation—tactile allodynia. HOM-KI rats did not display tactile allodynia as measured with von Frey filaments at eight days (12.2 ± 0.8 g, p = 0.84) or 15 days (13.82 ± 0.76 g, p = 0.084) post-SNL surgery compared to pre-SNL baseline (11.57 ± 1.2 g), indicating lack of development of neuropathic pain whereas WT controls developed tactile allodynia at 8 days (4.3 ± 0.5 g, ****p = 0.000003) and 15 days (5.3 ± 0.8 g, ****p = 0.00009) post-surgery which was significantly different compared to pre-surgery baseline (10.2 ± 1.2 g) (Two-way repeated measures ANOVA followed by Tukey’s multiple comparison test, main effect of time F (2,40) = 6.6762, p = 0.003, main effect of genotype F (1,20) = 36.222, p = 0.00007, n = 11/group). (h) Spinal nerve ligation—cold plate. HOM-KI rats did not respond to a 4°C cold plate and all reached the 300-s cut-off time. This was significantly different from WT controls (mean = 204 ± 24 s) (***Mann–Whitney U = 10, p = 0.0007; n = 10/group) 20 days post-SNL surgery. Data are mean ± SEM unless otherwise stated. HOM-KI: rats homozygous for the knock-in allele; WT: wild type; SNL: spinal nerve ligation.

