
Figure EV3. Localization of Gas2L1 tail domain mutants.
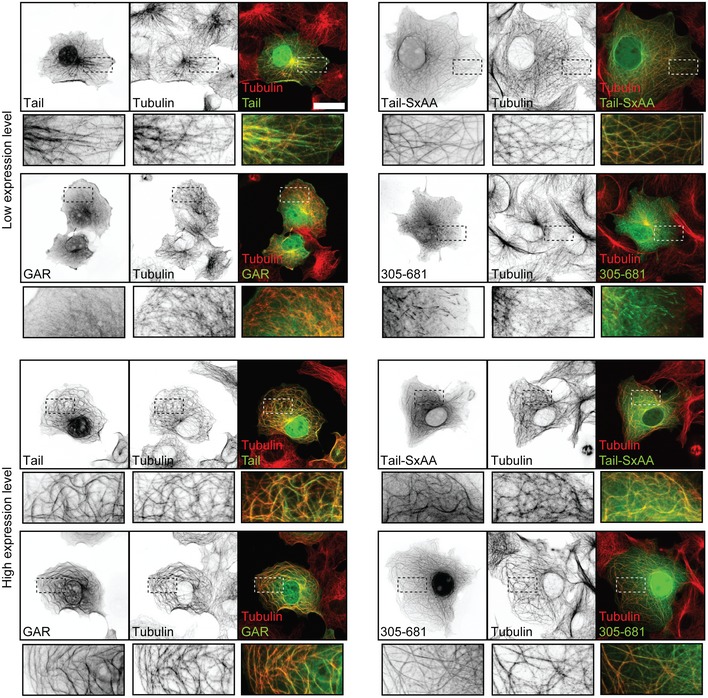
Localization of different Gas2L1 (G2L1) tail domain fragments overexpressed in COS7 cells at low (top panels) and high expression levels (lower panels) and stained for MTs (α‐tubulin), as well as merged images showing co‐localization of the Gas2L1 fragments with MTs. Bottom panels show enlargements of boxed regions. Data information: Scale bars: 30 μm.