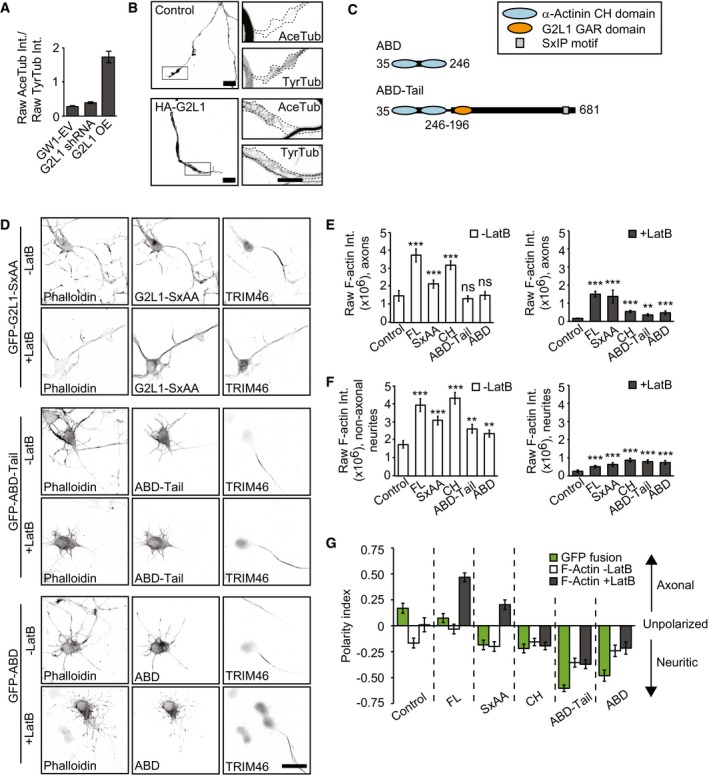
Figure EV5. The MT‐binding tail fragment does not influence localization of a different actin‐binding domain.

-
AQuantification of the ratio of raw acetylated tubulin (AceTub) intensity to raw tyrosinated tubulin (TyrTub) intensity in growth cones of DIV4 neurons transfected with GW1‐EV, G2L1 shRNA or HA‐G2L1 (G2L1 OE) and HA‐β‐galactosidase for 1 day. n = 56–85 growth cones from 37 to 43 neurons per condition (68 growth cones from 43 neurons for GW1‐EV, 56 growth cones from 37 neurons for G2L1 shRNA, 85 growth cones from 41 neurons for G2L1 OE) from three independent experiments.
-
BSilhouettes (from β‐galactosidase fill, left panels) of growth cones of DIV4 neurons, transfected with GW1‐EV (control, top panels) or HA‐Gas2L1 (bottom panels) and HA‐β‐galactosidase. Boxes indicate zoomed regions (right panels), showing staining for acetylated tubulin (AceTub) and tyrosinated tubulin (TyrTub). Dotted lines show the outline of the growth cone.
-
CSchematic overview of α‐actinin mutants used in (D‐G).
-
DAdditional conditions included in the experiment shown in Fig 6F: DIV3 neurons expressing GFP‐ABD or GFP‐ABD‐Tail and treated with 10 μM Latrunculin B for 30 min or non‐treated, stained for F‐actin (phalloidin) and the axon initial segment (TRIM46).
-
E, FAdditional conditions included in the experiment shown partially in Fig 6G and H: raw phalloidin staining intensities in axons (E) and non‐axonal neurites (pre‐dendrites) (F) of DIV3 neurons expressing the indicated GFP fusions and treated with 10 μM Latrunculin B for 30 min (grey bars) or non‐treated (white bars). n = 27–40 neurons per condition (40 for GFP, GFP‐G2L1, GFP‐CH, GFP‐ABD‐Tail, 35 for GFP‐SxAA, 27 for GFP‐ABD) from two independent experiments.
-
GAdditional conditions included in the experiment shown partially in Fig 6I: polarity index representing localization of the indicated GFP fusions in non‐treated neurons (green bars), and localization of F‐actin as labelled by phalloidin in DIV3 neurons treated with 10 μM Latrunculin B for 30 min (grey bars) or non‐treated (white bars). n = 27–40 neurons per condition (40 for GFP, GFP‐G2L1, GFP‐CH, GFP‐ABD‐Tail, 35 for GFP‐SxAA, 27 for GFP‐ABD) from two independent experiments. Positive values indicate axonal enrichment, negative values indicate neuritic enrichment, and a value of 0 signifies no particular enrichment.
