-
A
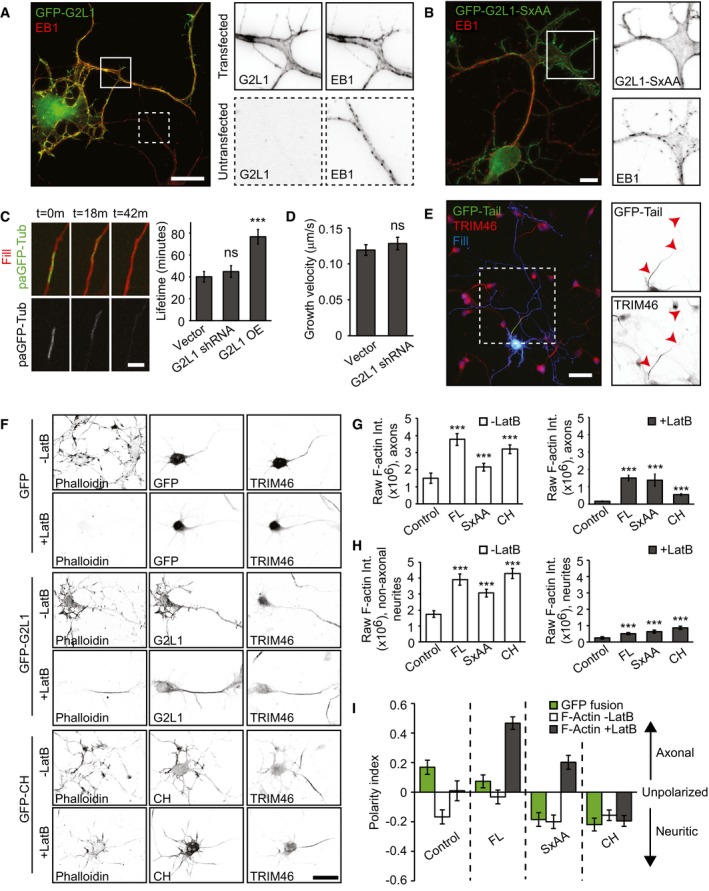
Endogenous EB1 re‐localization upon overexpression of GFP‐Gas2L1 (G2L1) in a DIV4 neuron. Boxes indicate zoomed regions of transfected (continuous outline) or untransfected neurons (dotted outline).
-
B
Endogenous EB1 localization upon overexpression of GFP‐Gas2L1‐SxAA (G2L1‐SxAA) in a DIV3 neuron. Boxes indicate zoomed region of transfected neuron.
-
C
Lifetime of photoactivated GFP‐α‐Tubulin signal in axons of DIV3–4 neurons electroporated at DIV0 with RFP, paGFP‐αTubulin and control GW1‐EV, or Gas2L1 shRNA, or HA‐Gas2L1. n = 54–59 axons per condition (59 for vector and HA‐Gas2L1, 54 for Gas2L1 shRNA) from three independent experiments.
-
D
Growth velocity of anterograde MT comets near the axon terminus, as labelled with EB3‐tagRFP‐T in DIV3–4 neurons electroporated at DIV0 with pSuper empty vector (control) or Gas2L1 shRNA. n = 27 neurons for control and 28 neurons for Gas2L1 shRNA (664–714 comets) per condition from two independent experiments.
-
E
Localization of GFP‐Tail in DIV3 neurons co‐expressing HA‐β‐galactosidase fill (blue) and stained for TRIM46 (red). Boxed region is enlarged to the right. Arrowheads indicate the axon.
-
F
DIV3 neurons expressing GFP control, GFP‐Gas2L1 or GFP‐CH and treated with 10 μM Latrunculin B for 30 min or non‐treated, stained for F‐actin (phalloidin) and the axon initial segment (TRIM46).
-
G, H
Raw phalloidin staining intensities in axons (G) and non‐axonal neurites (pre‐dendrites) (H) of DIV3 neurons expressing the indicated GFP fusions and treated with 10 μM Latrunculin B for 30 min (grey bars) or non‐treated (white bars). n = 35–40 neurons per condition (40 for GFP, GFP‐G2L1, GFP‐CH and 35 for GFP‐SxAA) from two independent experiments.
-
I
Polarity index representing localization of the indicated GFP fusions in non‐treated neurons (green bars) and localization of F‐actin as labelled by phalloidin in DIV3 neurons treated with 10 μM Latrunculin B for 30 min (grey bars) or non‐treated (white bars). n = 35–40 neurons per condition (40 for GFP, GFP‐G2L1, GFP‐CH and 35 for GFP‐SxAA) from two independent experiments. Positive values indicate axonal enrichment, negative values indicate neuritic enrichment, and a value of 0 signifies no particular enrichment.
Data information: Scale bars: 10 μm in (A, B), 4 μm in (C), 50 μm in (E), 30 μm in (F). Data are displayed as means ± SEM. Mann–Whitney test (C, G, H), unpaired
< 0.001.

