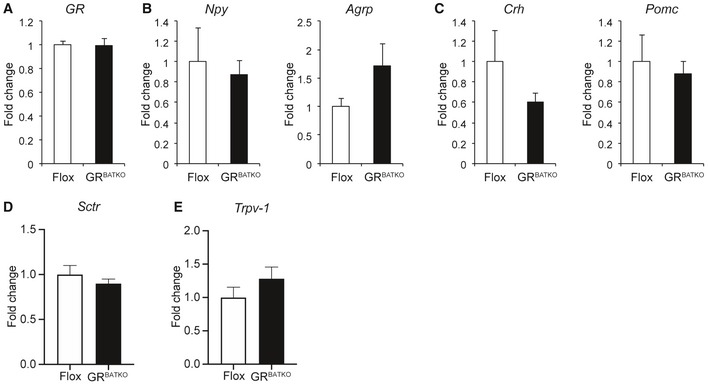
Figure EV2. Hypothalamic gene expression signature is comparable between GRBATKO and Flox control mice.

-
AGR mRNA levels in hypothalamus of Flox and GRBATKO animals after 24 weeks of high‐fat feeding (n = 5–9 samples per group).
-
BqRT–PCR analysis of orexigenic markers Npy and Agrp (n = 5–9 animals per group).
-
CCrh and Pomc mRNA levels in hypothalami of Flox and GRBATKO mice determined by qRT–PCR (n = 5–9 animals per group).
-
DSctrl mRNA levels in BAT of Flox and GRBATKO mice determined by qRT–PCR (n = 9–11 animals per group).
-
ETrpv‐1 mRNA levels in BAT of Flox and GRBATKO mice determined by qRT–PCR (n = 5–9 animals per group).
