-
A
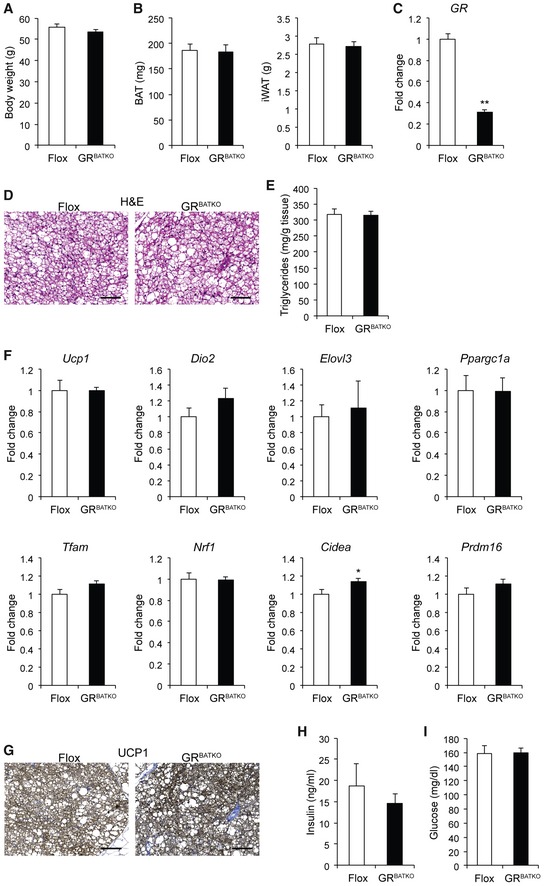
Body weight in Flox and GRBATKO after 24 weeks of high‐fat feeding (n = 10–13 animals per group).
-
B
BAT and iWAT weight in Flox and GRBATKO mice fed HFD for 24 weeks (n = 10–13 animals per group).
-
C
GR levels in BAT after 24 weeks high‐fat feeding (n = 10–13 mice per group).
-
D
Representative H&E‐stained sections of BAT from Flox and GRBATKO animals. Scale bar 100 μm.
-
E
Triglyceride content in BAT per gram of wet tissue (n = 10–13 animals per group).
-
F
qRT–PCR analysis of thermogenic marker gene expression in BAT of Flox and GRBATKO mice after high‐fat feeding (n = 9–13 animals per group).
-
G
Representative immunohistochemistry for UCP1 in BAT. Scale bar 100 μm.
-
H
Serum insulin levels determined by ELISA (n = 10–13 animals per group).
-
I
Blood glucose in Flox and GRBATKO animals after 24 weeks HFD (n = 10–13 animals per group).
‐test (C, F). *
< 0.01. Error bars denote SEM.

