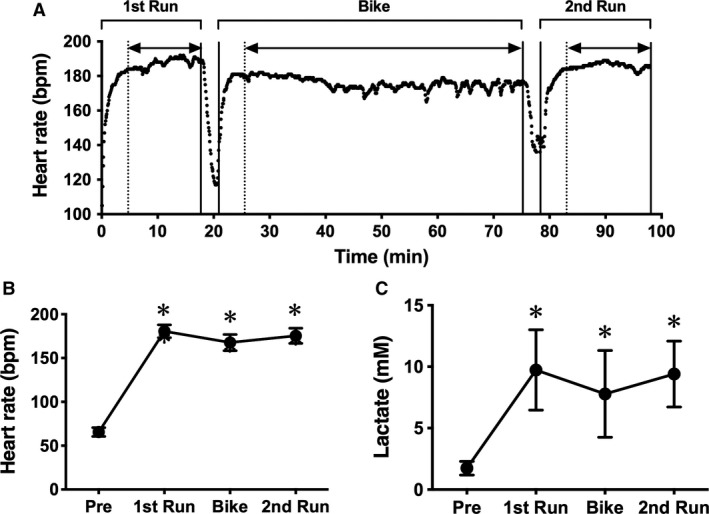
Figure 1.

Heart rate (HR) and lactate concentration during a simulated duathlon race. A typical example of time course changes in HR during the race (A) and averaged HR in each part (B) is shown. Double‐headed arrow indicates the time span used to calculate the average HR. Lactate concentration (C) was measured before the race and after each part. The data are expressed as mean ± SD. *P < 0.05 versus pre.
