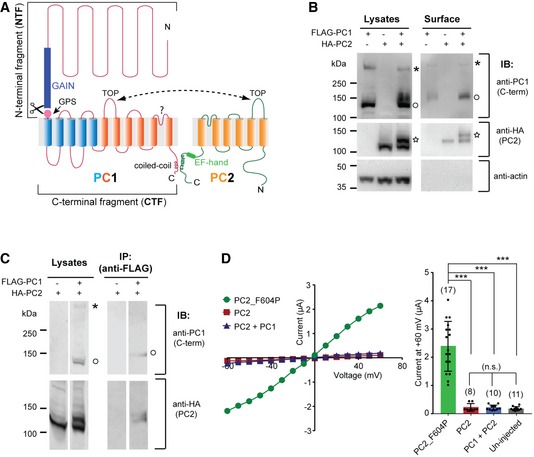
Figure 1. PC1 and PC2 express in Xenopus oocytes but yield no channel current.

- Transmembrane topology of PC1 and PC2 proteins. The two proteins associate at the C‐terminus through the coiled‐coil domains and the extracellular side via the TOP domains. The GAIN domain and the GPS site in PC1 and the EF‐hand motif in PC2 are indicated. The last six transmembrane domains of PC1 (shown in orange) share sequence similarity with PC2.
- Western blot of oocyte lysate (left) and biotinylation‐purified surface (right) samples showing the expression of PC1 and PC2 in Xenopus oocytes and enhanced surface trafficking of the PC1/PC2 complex compared to either protein expressed individually. Anti‐PC1 C‐terminus antibody 29 recognized both full‐length (asterisk) and GPS‐cleaved CTF (open circle) of PC1. A higher‐glycosylated 130 kDa PC2 (star) band was only seen when PC1 is coexpressed.
- Co‐IP followed by Western blot showing the association between PC1 and PC2 that were expressed in Xenopus oocytes. IP was done with an anti‐FLAG antibody. Bands of full‐length (asterisk) and GPS‐cleaved CTF (open circle) of PC1 are indicated. Both 120 and 130 kDa bands of PC2 were seen in the IPed product.
- Representative current–voltage relationship (I–V) curves (left) and a scatter plot and bar graph (right) showing coexpression of WT PC1 and PC2 produced no current in TEVC recording. The current of the GOF PC2_F604P is included as a control. Currents at +60 mV are shown in the bar graph. Each point represents the recorded current from one oocyte. Oocyte numbers for scatter plot and bar graph are indicated in parentheses. Data are presented as mean ± SD (n.s.: not significant, ***P < 0.001, Student's t‐test).
Source data are available online for this figure.
