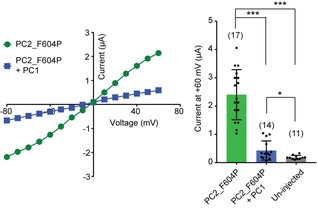
Figure EV1. Coexpression of PC1 greatly inhibited the current of PC2_F604P.

Left: representative current–voltage (I–V) curves of the indicated protein combinations. Right: Scatter plot and bar graph show the average currents at +60 mV. Oocyte numbers are indicated in parentheses. Data are presented as mean ± SD in bar graph (*P < 0.05, ***P < 0.001, Student's t‐test).Source data are available online for this figure.
