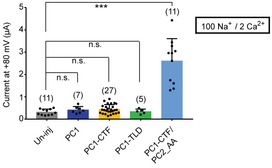
Figure EV3. Expressing full‐length PC1, PC1‐CTF, or PC1‐TLD without PC2_AA in Xenopus oocytes did not give rise to significant current.

Scatter plot and bar graph show the average current sizes of oocytes expressing indicated full‐length or fragment PC1 proteins in a solution containing 100 mM Na+ and 2 mM Ca2+. Oocytes expressing both PC1‐CTF and PC2_AA were used as a positive control. Oocyte numbers are indicated in parentheses. Data are presented as mean ± SD in bar graph (n.s.: not significant, ***P < 0.001, Student's t‐test).Source data are available online for this figure.
