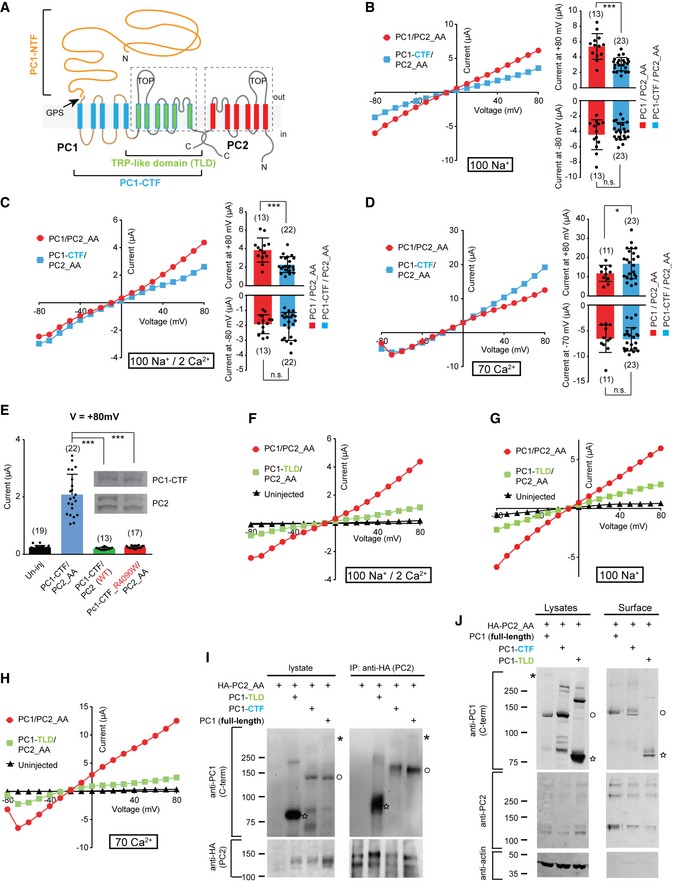
Figure 4. Both the CTF and the TRP‐like domain (TLD) are sufficient for ion channel function of PC1 in the PC1/PC2 complex.

-
ATransmembrane topology of PC1 and PC2 proteins, showing the NTF, CTF, and the TLD of PC1. The six transmembrane domains in TLD (indicated with the dashed line box) share sequence homology with the transmembrane domains of PC2.
-
B–DRepresentative I–V curves (left) and scatter plot and bar graphs (right) showing the comparison between the currents of full‐length PC1/PC2_AA with that of PC1‐CTF/PC2_AA in bath solutions containing 100 mM Na+ (B), 100 mM Na+ and 2 mM Ca2+ (C), or 70 mM Ca2+ (D). Currents at both +80 mV and −80 (or −70) mV are displayed in the scatter plot and bar graphs. Oocyte numbers are indicated in parentheses. Data are presented as mean ± SD in bar graph (n.s.: not significant, *P < 0.05; ***P < 0.001, Student's t‐test).
-
EScatter plot and bar graph showing that the current of PC1‐CTF/PC2_AA is completely abolished when WT PC2 was used, or after introducing R4090W mutation in the putative pore region of PC1‐CTF. Inserted are Western blot images showing the expression of the corresponding proteins. Top: anti‐PC1. Bottom: anti‐PC2. Oocyte numbers are indicated in parentheses. Data are presented as mean ± SD in bar graph (***P < 0.001, Student's t‐test).
-
F–HRepresentative I–V curves of oocytes injected with the indicated RNAs in a bath solution containing 100 mM Na+ and 2 mM Ca2+ (F), 100 mM Na+ (G), or 70 mM Ca2+ (H), showing PC1‐TLD/PC2_AA gave rise to current with similar properties as full‐length PC1/PC2_AA channel.
-
ICo‐IP followed by Western blot showing the association between PC2_AA and the indicated full‐length or fragment PC1. Bands of full‐length (asterisk), GPS‐cleaved CTF or expressed CTF fragment (open circle), and TLD (star) of PC1 are indicated.
-
JSurface biotinylation followed by Western blot showing the expression of the complexes formed between PC2_AA and full‐length PC1, PC1‐CTF, or PC1‐TLD at the oocyte surface. Besides the blots shown in the figure, surface samples were also blotted with an anti‐PC1 N‐terminus antibody, and the cleaved NTF fragment was found associated with the plasma membrane in the full‐length sample (shown in Appendix Fig S4). Bands of full‐length (asterisk), GPS‐cleaved CTF or expressed CTF fragment (open circle), and TLD (star) of PC1 are indicated.
Source data are available online for this figure.
