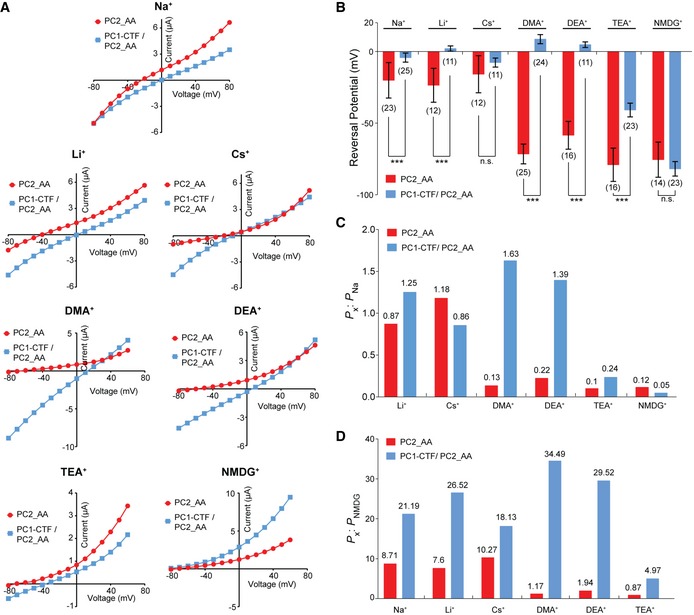
Figure 5. PC1‐CTF/PC2_AA heteromeric channel has a different ion permeability to that of the PC2_AA homomeric channel.

-
ARepresentative I–V curves of the PC2_AA and PC1‐CTF/PC2_AA channels in divalent ion‐free bath solutions containing 100 mM of indicated ions, showing the differences in reversal potential.
-
BBar graphs showing the markedly different reversal potentials of PC2_AA channel and the PC1‐CTF/PC2_AA channel in bath solutions containing 100 mM of the indicated ions. Oocyte numbers are indicated in parentheses. Data are presented as mean ± SD (n.s.: not significant, ***P < 0.001, Student's t‐test).
-
C, DBar graphs showing the permeability ratios of the indicated ions to that of Na+ (P x: P Na) (C) and NMDG+ (P x: P NMDG) (D). These ratios are strikingly different between the two channels. The ratios of the particular ions, which are the values of the bars, are indicted on top of the bars.
Source data are available online for this figure.
