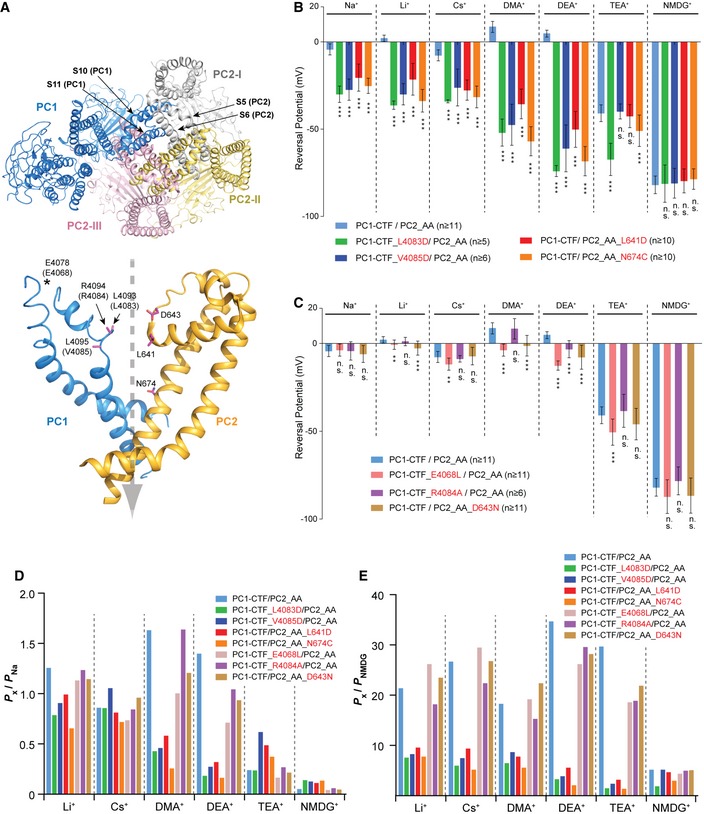
Figure 6. Pore mutations in PC1 or PC2 led to changes in ion permeability of the PC1‐CTF/PC2_AA channel.

-
ATOP: a bottom view of a previously reported cryo‐EM structure of PC1/PC2 channel (PDB code 6A70) 42, which is missing the NTF of PC1 and the intracellular C‐terminal tails from both proteins. S10‐S11 of one PC1 subunit and S5‐S6 from three PC2 subunits assembled to form the pore. Bottom: The mutated amino acids in this experiment (in purple) are mapped on S10‐S11 of one PC1 and S5‐S6 of one PC2 subunit in the complex. The dashed gray arrow indicates the putative ion flow path. Since human PC1 was used for structure determination, mouse amino acids mutated in this study are indicated in parentheses. Due to the low resolution of the PC1 pore region in the structure, side chains are not seen for the three mutated amino acids at the putative selectivity filter region. E4068 (E4078 in human) is not solved in the structure, and it is labeled to indicate its approximate location in the structure.
-
B, CBar graphs showing the reversal potentials of PC1‐CTF/PC2_AA and the indicated mutants tested in bath solutions containing 100 mM of the indicated ions. Two PC1 and two PC2 mutations caused dramatic changes in the reversal potential for almost all tested ions (B), indicating that these amino acids are essential for ion permeability. Another two PC1 mutations and one PC2 mutation only led to relatively small changes of reversal potential for some ions but not others (C), indicating a less important role of these amino acids in ion permeability. Statistical significance between reversal potentials of all pore mutants and that of the PC1‐CTF/PC2_AA channel is indicated. Representative I–V curves are shown in Fig EV5. Oocyte numbers are indicated in parentheses. Data are presented as mean ± SD (n.s.: not significant, **P < 0.01, ***P < 0.001, Student's t‐test).
-
D, EBar graphs showing the permeability ratios of the indicated ions to that of Na+ (P x: P Na) (D) and NMDG+ (P x: P NMDG) (E). Pore mutations in both PC1 and PC2 lead to significant changes in the permeability ratios in most of the cases.
Source data are available online for this figure.
