-
A
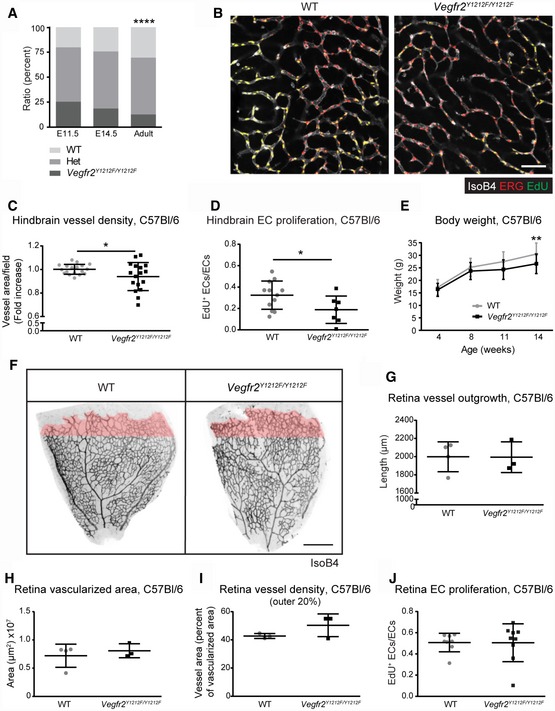
Partial embryonic lethality after E11.5. Chi‐square, ****P < 0.0001. E11.5 n = 114 embryos, E14.5 n = 70 embryos, adult n = 314 born pups.
-
B
Hindbrain vessel morphology. Isolectin B4 (IsoB4; white), ERG (red), and EdU incorporation (green). EdU signal was masked with ETS‐related gene (ERG) signal. Scale bar, 50 μm.
-
C
Hindbrain vessel density. Isolectin B4 vessel area normalized to wild‐type (WT) mean; one dot is two fields/mouse; error bars: SD; unpaired t‐test, *P < 0.05. n = 18–20.
-
D
Hindbrain EC proliferation. EdU incorporation in ERG‐positive ECs (double‐positive cells, yellow in B). One dot is two fields/mouse; error bars: SD; unpaired t‐test, *P < 0.05. n = 7–12.
-
E
Reduced weight gain in the adult. Error bars: SD; 2‐way ANOVA P = 0.0009; Sidak's multiple comparison test, **P < 0.01. n = 13–20 mice.
-
F
P6 retina vessel morphology. Isolectin B4 (IsoB4) in black; the outer 20% of the vascularized area in pink. Scale bar, 250 μm.
-
G–J
Vessel parameters in the P6 developing retina. (G) Radial outgrowth (distance between optic nerve and vascular front). (H) Vascularized area. (I) Vessel area in the outer 20% of the retinal vasculature; pink in (F) (vessel area normalized to vascularized area). Each dot represents one retina/mouse; n = 3–4. (J) EdU incorporation in ERG‐positive ECs normalized to total ERG‐positive ECs. Each dot represents one retina/mouse; error bars: SD. n = 8–9.

