
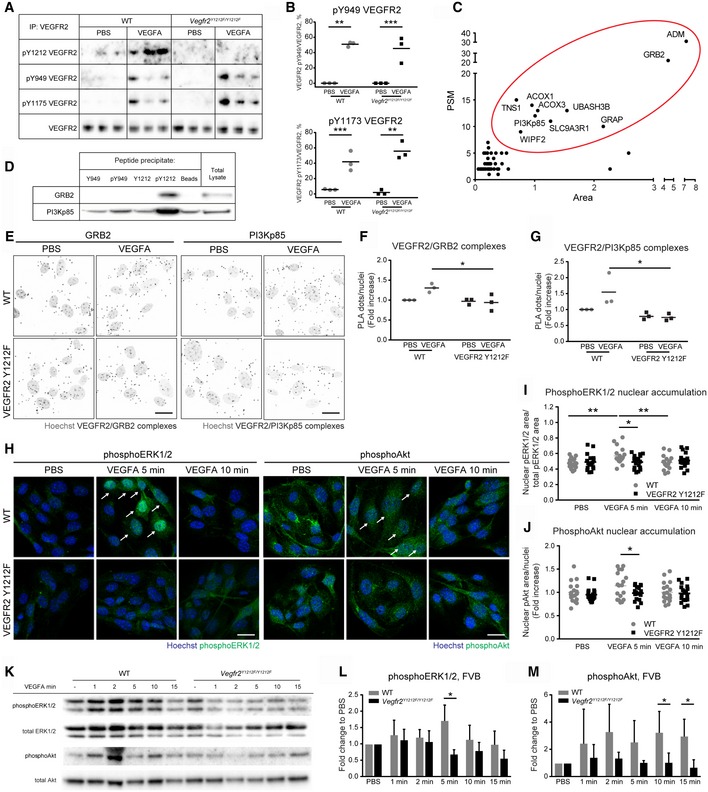
Figure 3. Specific binding of VEGFR2 Y1212 to GRB2 and PI3Kp85.
-
A, BImmunoblot showing VEGFR2 phosphorylation on pY1212, pY949, and pY1173. (A) Anti‐VEGFR2 immunoprecipitates (IP) from lung lysates from wild‐type (WT) and Vegfr2 Y1212F/Y1212F FVB mice, tail‐vein‐injected with PBS or VEGF for 1 min. (B) Quantification as percentage of phosphoprotein level normalized to total VEGFR2. Each lane (A) and each dot (B) represent one individual mouse. Sidak's multiple comparison test, *P < 0.05, **P < 0.01, ***P < 0.001. n = 3.
-
CSummary plot of 51 proteins enriched in the immobilized pY1212 peptide precipitate. Ten proteins (red oval) were selected for further analysis. PSM: peptide‐spectrum match. Area: average area of spectra for the three most abundant peptides in arbitrary units.
-
DBlot for peptide‐enriched GRB2 and PI3Kp85. HDMEC total lysate incubated with indicated immobilized peptides followed by immunoblotting for GRB2 and PI3Kp85.
-
E–GVEGFR2/GRB2 and VEGFR2/PI3Kp85 complexes in isolated (i) ECs. (E) PLA for VEGFR2/GRB2 and VEGFR2/PI3Kp85 complexes (black puncta) in iECs from FVB WT and Vegfr2 Y1212F/Y1212F lungs. Hoechst 33342 show nuclei (gray). Scale bar, 20 μm. (F, G) Fold increase over PBS‐treated sample; each dot represents the mean of six fields. Two‐way ANOVA P = 0.0206 (F), P = 0.0368 (G); Sidak's multiple comparison test, *P < 0.05. n = 3 experiments.
-
HphosphoERK1/2 and phosphoAkt immunostaining (green) of iECs from FVB WT and Vegfr2 Y1212F/Y1212F lungs. Hoechst 33342 (blue) shows nuclei. Arrows indicate nuclear accumulation of phosphoERK1/2 and phosphoAkt, respectively. Scale bar, 20 μm.
-
INuclear accumulation expressed as phosphoERK1/2‐positive nuclear area normalized to the total phosphoERK1/2 area by field. Each dot represents 1 field. Min, minutes of stimulation. Two‐way ANOVA P = 0.0248; Sidak's multiple comparison test, *P < 0.05, **P < 0.01. n = 3 experiments.
-
JNuclear accumulation expressed as fold increase of nuclear phosphoAkt area in Vegfr2 Y1212F/Y1212F over PBS‐treated WT iECs, normalized to the number of nuclei. Each dot represents 1 field. Min, minutes of stimulation. Unpaired t‐test, *P < 0.05. n = 3 experiments.
-
KImmunoblot for phosphoERK1/2, total ERK1/2, phosphoAkt, and total Akt on lung lysates from WT and Vegfr2 Y1212F/Y1212F FVB mice tail‐vein‐injected with PBS or VEGFA followed by circulation for time points indicated. Each lane represents one individual mouse.
-
LQuantification of phosphoERK1/2/total ERK1/2 expressed as fold change to PBS. Min, minutes of stimulation. Error bars: SD; 2‐way ANOVA P = 0.0025; unpaired t‐test, *P < 0.05. n = 3 experiments.
-
MQuantification of phosphoAkt/total Akt expressed as fold change to PBS. Min, minutes of stimulation. Error bars: SD; 2‐way ANOVA P = 0.0003; unpaired t‐test, *P < 0.05. n = 3 experiments.
Source data are available online for this figure.