-
A
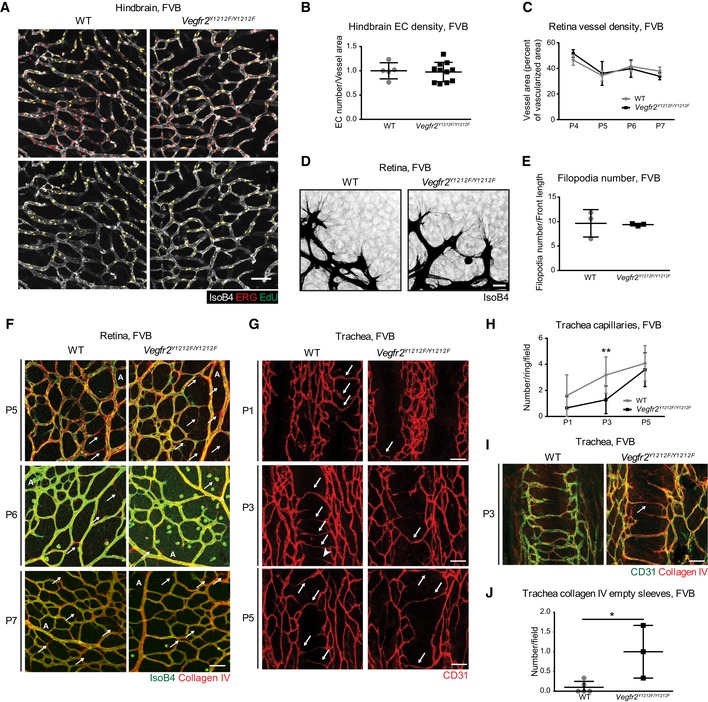
EC proliferation in FVB E11.5 hindbrains. EdU incorporation (green) in ERG (red) and isolectin B4 (IsoB4, white)‐positive ECs. Double‐positive cells (yellow) alone are shown in the lower panel. EdU signal was masked with ERG signal. Scale bar, 50 μm.
-
B
EC density in FVB hindbrain vasculature. Quantification of ERG‐positive ECs normalized to IsoB4‐positive area and to WT mean of the litter; each dot represents the mean of two fields/mouse. Error bars: SD; unpaired t‐test, not significant. n = 5–11.
-
C
Vessel density in the FVB P6 retina. Isolectin B4 (IsoB4) vessel area normalized to vascularized area. Error bars: SD. P4 n = 3–5 retinas, one retina/mouse, P5 n = 4–9, P6 n = 9–9, P7 n = 4–5.
-
D
Filopodia in FVB P6 retina. Isolectin B4 (IsoB4, black)‐positive ECs. Scale bar, 20 μm.
-
E
Quantification of filopodia in FVB P6 retina. Number of filopodia by front length in μm. Each dot represents the mean number of filopodia of 3 fields/retina/mouse; error bars: SD. n = 3.
-
F
Empty sleeves in the FVB P6 retina. Immunostaining for isolectin B4 (IsoB4, green) and collagen IV (red) in P5‐P7 FVB WT and Vegfr2
Y1212F/Y1212F retinas. Arrows indicate collagen IV‐positive empty sleeves. A, artery. Scale bar, 50 μm.
-
G
Postnatal FVB tracheal vasculature. CD31 staining of the capillary bed at P1, P3, and P5. Scale bar, 50 μm. Arrows indicate capillaries spanning the cartilage rings.
-
H
Quantification of capillaries in the FVB trachea. Number of capillaries over one cartilage ring. Error bars: SD; 2‐way ANOVA P < 0.0001; Bonferroni's multiple comparison test, **P < 0.01. P1, 4 rings/mouse; n = 4–8. P3, 3 rings/mouse; n = 3–5. P5, 3 rings/mouse; n = 5–12.
-
I
Collagen empty sleeves in the FVB P3 trachea. Immunostaining for CD31 (green) and collagen IV (red). Arrows show collagen IV empty sleeves. Scale bar, 50 μm.
-
J
Quantification of empty sleeves in the FVB P3 tracheas. Each dot represents the mean number of empty sleeves per field over 3 cartilage rings/mouse; error bars: SD; unpaired t‐test, *P < 0.05; n = 3–5.

