-
A
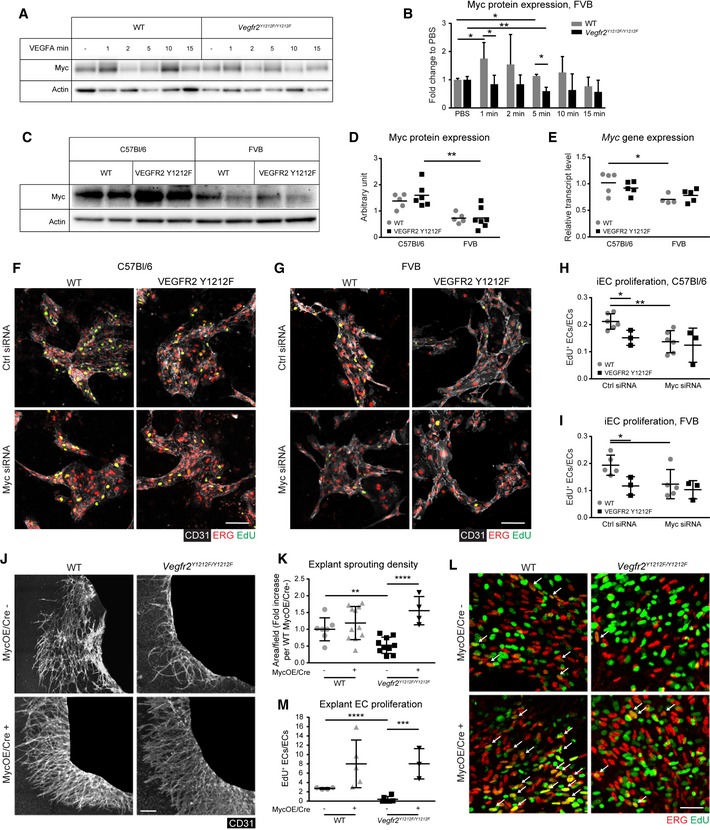
Immunoblot for Myc on lung lysates from wild‐type (WT) and Vegfr2
Y1212F/Y1212F FVB mice tail‐vein‐injected with PBS or VEGFA followed by circulation for time points indicated. Each lane represents one individual mouse.
-
B
Quantification of Myc/actin expressed as fold change to PBS. Min, minutes of stimulation. Error bars: SD; 2‐way ANOVA P = 0.0058; unpaired t‐test, *P < 0.05, **P < 0.01. n = 3 experiments.
-
C, D
Myc protein expression. (C) Myc and actin immunoblotting on lysates of lung isolated ECs from untreated WT and mutant (VEGFR2 Y1212F) C57Bl/6 and FVB mice. (D) Quantification of Myc/actin expressed as arbitrary units. Each lane (C) and each dot (D) represent one individual mouse. Two‐way ANOVA P < 0.0001; unpaired t‐test, **P < 0.01. n = 5–7.
-
E
Baseline transcriptional level of Myc from lung isolated ECs from untreated WT and mutant (VEGFR2 Y1212F) C57Bl/6 and FVB mice. Each dot represents one individual mouse. Two‐way ANOVA P = 0.0041; Sidak's multiple comparison test, *P < 0.05. n = 4–5.
-
F–I
Proliferation of C57Bl/6 and FVB iECs. (F, G) CD31 (white), ERG (red), EdU (green), and double‐positive cells (yellow) in C57Bl/6 (F) and FVB (G) iECs. EdU signal was masked with ERG signal. (H, I) EdU incorporation in ERG‐positive ECs normalized to total ERG‐positive ECs. Each dot represents 2 fields/well, one well/mouse. Scale bar, 100 μm. Error bars: SD; 2‐way ANOVA P = 0.0843 (H), P = 0.0474 (I); unpaired t‐test, *P < 0.05; **P < 0.01. C57Bl/6 n = 3–6 mice, FVB n = 3–5 mice.
-
J, K
Rescue of angiogenic sprouting by Myc overexpression in E11.5 C57Bl/6 Vegfr2
Y1212F/Y1212F explant tissue. (J) Representative images of E11.5 explants from C57Bl/6 embryos taken from WT and Vegfr2
Y1212F/Y1212F littermates with (MycOE/Cre+) and without (MycOE/Cre−) endothelial‐specific overexpression of Myc. Endothelial cell marker (CD31) immunostaining highlights the vasculature in white. Embryonic tissue blacked out to highlight sprouting area. (K) Quantification as fold increase in vessel sprouting area compared to WT MycOE/Cre−. Scale bar, 250 μm. Error bars: SD; unpaired t‐test, **P < 0.01, ****P < 0.0001. n = 4–11 explants, one explant/embryo.
-
L, M
Rescue of EC proliferation. (L) Myc overexpression in E11.5 C57Bl/6 Vegfr2
Y1212F/Y1212F explant tissue. ERG (red), EdU (green), and double‐positive cells (yellow; arrows). (M) Quantification of EdU/ERG double‐positive ECs normalized to total ECs. Scale bar, 50 μm. Error bars: SD; unpaired t‐test, ***P < 0.001, ****P < 0.0001. n = 3–7 explants, one explant/embryo.

